How to Read an ECG (Beginner's Walkthrough)
Learning how to read an ECG feels overwhelming at first, but almost every tracing yields to the same short, repeatable routine — and once you own that routine, the squiggles start telling a story.
- What an ECG Actually Shows
- Reading the Grid: Boxes, Time, and Voltage
- The Waves, Segments, and Intervals
- A Systematic 6-Step Method
- Step 1: Calculating Heart Rate
- Step 2: Determining the Rhythm
- A Worked Example, Start to Finish
- Spotting the ST Segment and Dangerous Findings
- Building Skill: Practice and Common Pitfalls
- Key Takeaways
What an ECG Actually Shows
An electrocardiogram (ECG, or EKG) is a voltage-versus-time recording of the heart's electrical activity, picked up by electrodes on the skin. It does not show blood flow, valve motion, or pumping strength directly — for those you need an echocardiogram or hemodynamic data. What it does show is the sequence and timing of electrical waves that sweep through the heart with every beat, and that sequence is astonishingly informative.
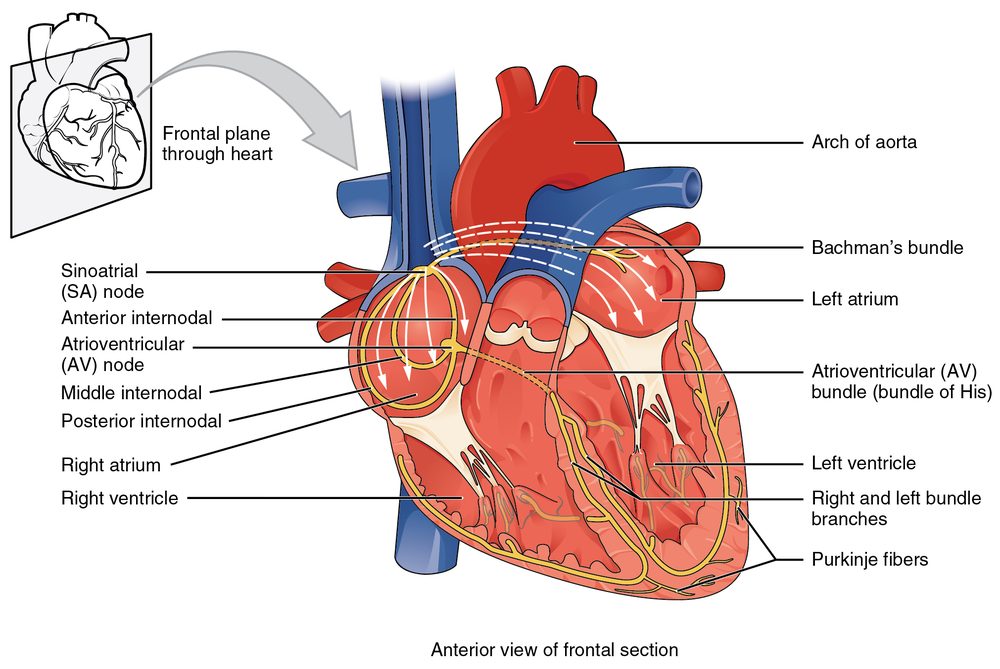
Each heartbeat traces a familiar set of deflections. The P wave is atrial depolarization. The QRS complex is ventricular depolarization — the big spike. The T wave is ventricular repolarization, the recovery phase. In between sit the intervals and segments that tell you how fast the signal travels through the wiring. If the anatomy of that wiring is fuzzy, our primer on the cardiac conduction system and the deeper cardiac anatomy guide are worth a quick detour before you go further.
A standard clinical ECG uses 12 leads — really 12 different electrical viewpoints of the same heart from ten electrodes. Each lead looks at the heart from a slightly different angle, which is how the tracing can localize where a problem lives. For beginners, the reassuring news is that you do not have to master all twelve at once. A single rhythm strip from lead II teaches most of the fundamentals, and the full 12-lead reading is just the same skills applied from more angles.
This article is educational and written for RCIS exam preparation. It is not medical advice; real interpretation belongs to a qualified clinician using the full clinical picture.
Reading the Grid: Boxes, Time, and Voltage
Before you can read a single wave you have to read the paper. ECG grids are standardized so any tracing means the same thing anywhere in the world, provided it runs at the conventional speed of 25 mm per second with a calibration of 10 mm per millivolt. Confirm those two numbers first — a mislabeled speed will wreck every measurement that follows.
The grid has small boxes and large boxes. Each small box is 1 mm; each large box is made of five small boxes, so it is 5 mm across.
| Box | Horizontal (time) | Vertical (voltage) |
|---|---|---|
| Small box (1 mm) | 0.04 s (40 ms) | 0.1 mV |
| Large box (5 mm) | 0.20 s (200 ms) | 0.5 mV |
| Five large boxes | 1.0 s | 2.5 mV |
Those numbers are the backbone of everything. A QRS that spans more than three small boxes (over 120 ms) is 'wide.' A PR interval longer than one large box (over 200 ms) is prolonged. And because five large boxes equal one second, thirty large boxes equal six seconds — the standard window for eyeballing rate on a rhythm strip. Commit the small-box value of 0.04 s to memory and the rest of the math falls out of it.
The Waves, Segments, and Intervals
Once the grid makes sense, name the parts. Reading them in order — P, then QRS, then T, with the intervals between — keeps you from skipping something. This is where the phrase ecg for beginners stops being intimidating, because there are only a handful of features to track.
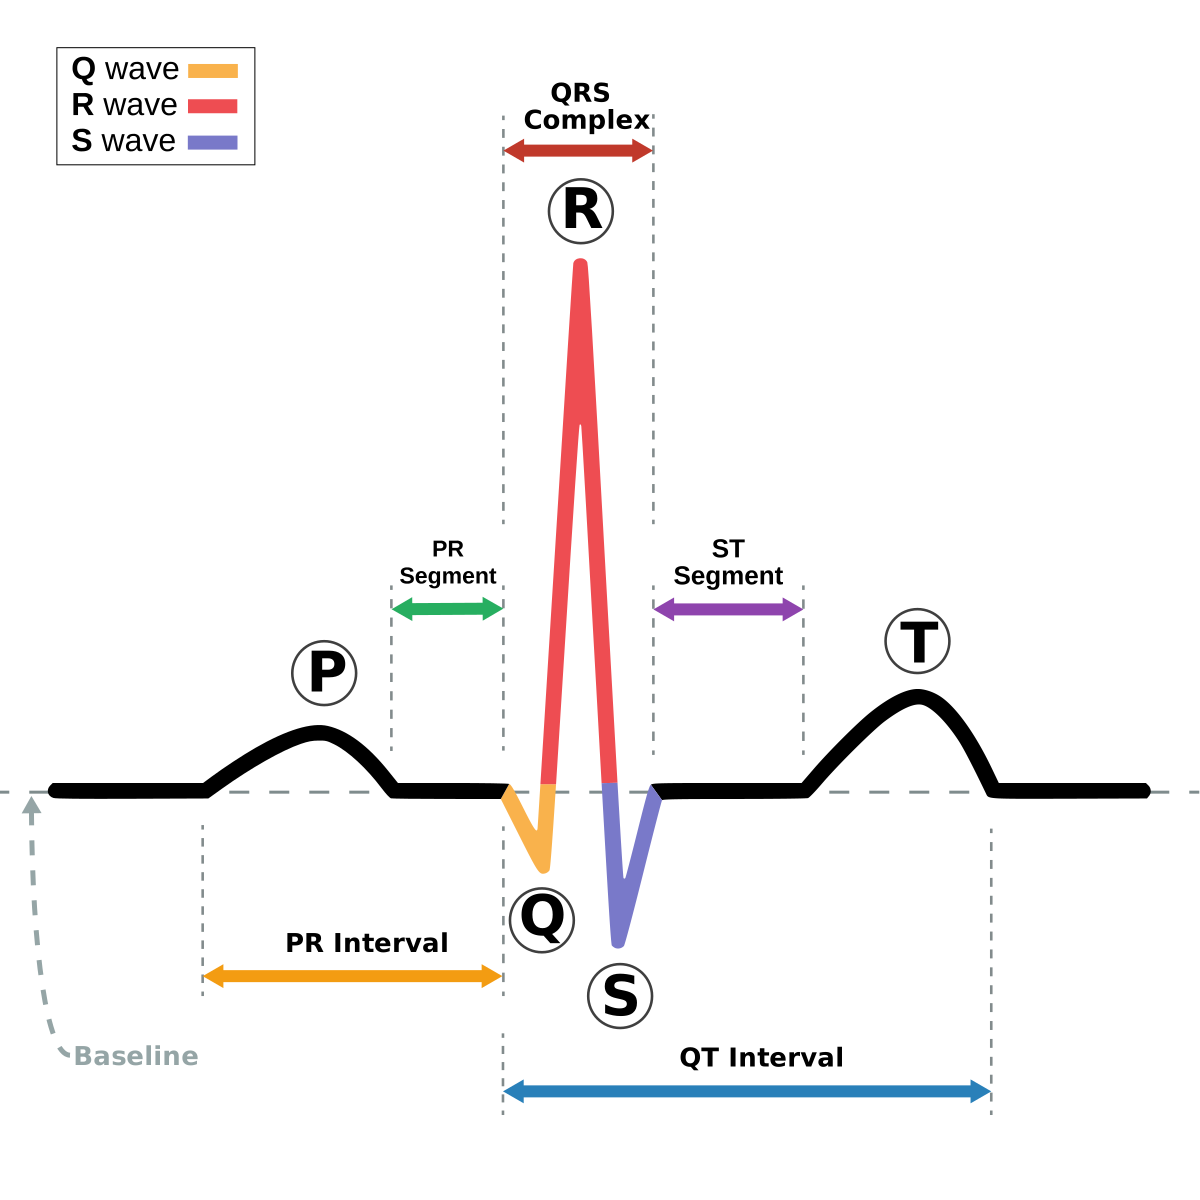
- P wave — atrial depolarization. Normally small, rounded, and upright in lead II. It should be under 120 ms wide and about 2.5 mm tall.
- PR interval — start of P to start of QRS, normally 120–200 ms (three to five small boxes). This is the time the impulse spends crossing the atria and being delayed at the AV node.
- QRS complex — ventricular depolarization, normally under 120 ms. A wide QRS means the ventricles were activated abnormally.
- ST segment — the flat stretch from QRS to T wave. Normally at baseline; elevation or depression here is a red flag for ischemia or infarction.
- T wave — ventricular repolarization, usually upright and asymmetric.
- QT interval — start of QRS to end of T, reflecting total ventricular electrical activity. It shortens as heart rate rises, so it is corrected for rate (QTc).
The QT deserves special care because a long QT predisposes to dangerous rhythms. Since it must be adjusted for heart rate, most people use a formula rather than the raw value — our dedicated page on the QT interval and the QTc calculator handle that math for you. For a fuller tour of every wave in context, the ECG study guide and the broader ECG interpretation pillar go deeper than we can here.
A Systematic 6-Step Method
Expert readers are not faster because they see more — they are faster because they follow the same checklist every single time and never improvise the order. Adopt a fixed sequence now and it becomes automatic later. Here is a reliable six-step approach that covers the essentials without leaving gaps.
- Rate — how fast? Is it too slow (bradycardia), normal, or too fast (tachycardia)?
- Rhythm — is it regular or irregular? March out the R-R intervals.
- P waves — is there one P before every QRS, and one QRS after every P? Do they look normal and upright?
- PR interval — is it normal (120–200 ms), long, short, or variable?
- QRS — is it narrow (under 120 ms) or wide? Narrow points above the ventricles; wide points to the ventricles or abnormal conduction.
- ST-T and QT — is the ST segment at baseline? Are T waves normal? Is the QT reasonable?
Notice that rate and rhythm come first — they are the two questions that most often change management, and together they classify the great majority of tracings. Everything after that refines the picture. The same discipline underlies our step-driven walkthroughs in the ECG interpretation basics and the printable ECG cheat sheet, which you can keep beside you while the sequence is still new.
Step 1: Calculating Heart Rate
There are three practical ways to find the rate, and which one you reach for depends on whether the rhythm is regular.
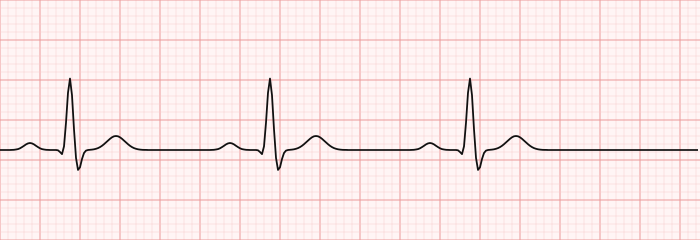
The 300 rule (regular rhythms). Pick an R wave that lands on a heavy gridline, then count off the large boxes to the next R wave and divide 300 by that number. One large box between beats is 300 bpm, two is 150, three is 100, four is 75, five is 60, and six is 50. Memorizing that sequence — 300, 150, 100, 75, 60, 50 — lets you read rate at a glance.
| Large boxes between R waves | Heart rate (bpm) |
|---|---|
| 1 | 300 |
| 2 | 150 |
| 3 | 100 |
| 4 | 75 |
| 5 | 60 |
| 6 | 50 |
The 1500 rule (precise, regular rhythms). Count the small boxes between two R waves and divide 1500 by that number. If R waves are 20 small boxes apart, the rate is 75. This is the method to use when you need an exact number.
The 6-second method (irregular rhythms). When the rhythm is irregular — atrial fibrillation being the classic case — box counting fails, so count the QRS complexes in a 6-second strip (30 large boxes) and multiply by 10. Eight complexes in six seconds is roughly 80 bpm.
Step 2: Determining the Rhythm
With a rate in hand, ask whether the beats are regular. The quickest test is to walk a pair of caliper points (or the edge of a paper card with two pen marks) across successive R waves. If the spacing holds, the rhythm is regular; if it drifts, it is irregular. Then combine regularity with the QRS width and the P waves to name the rhythm.
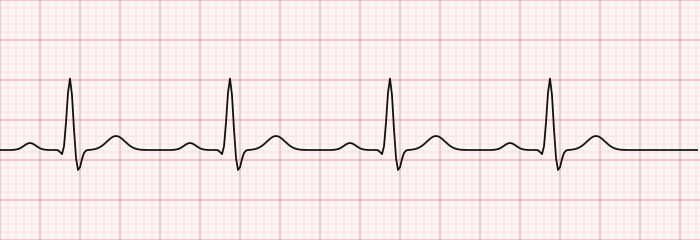
The reference point for everything is normal sinus rhythm: a regular rhythm at 60–100 bpm, with an upright P wave before every QRS, a normal PR interval, and a narrow QRS. Learn this pattern cold, because you diagnose abnormal rhythms largely by how they deviate from it.
From there, a few high-yield patterns account for most of what you will see:
- Irregularly irregular, no clear P waves — think atrial fibrillation.
- Regular, narrow, and very fast (150+) — think supraventricular tachycardia or atrial flutter.
- Regular, wide, and fast — treat as ventricular tachycardia until proven otherwise.
- Progressive PR lengthening or dropped beats — some form of heart block.
To turn recognition into a reflex, drill real tracings: our ECG rhythm interpretation page organizes rhythms into a regular-versus-irregular, narrow-versus-wide matrix, and the interactive ECG strip practice set makes you commit to an answer on strip after strip.
A Worked Example, Start to Finish
Theory sticks once you run the checklist on a real strip. Let's take the normal sinus rhythm tracing above and read it the way you would on the exam, walking every step so the method becomes concrete. Treat this as a worked example template you can reuse on any strip.
| Step | What we look for | Finding on this strip |
|---|---|---|
| 1. Rate | 300 rule / 6-second method | R waves ~5 large boxes apart → 300 ÷ 5 ≈ 60 bpm |
| 2. Rhythm | R-R regular? | Regular — R-R spacing is constant |
| 3. P waves | One upright P before each QRS? | Yes, upright in lead II, uniform shape |
| 4. PR interval | 120–200 ms? | ~160 ms (four small boxes) — normal |
| 5. QRS | Narrow (<120 ms)? | ~90 ms — narrow |
| 6. ST-T / QT | ST at baseline, T normal, QT reasonable? | ST isoelectric, T waves upright, QT normal |
Reading it out: "Rate about 60, regular, P before every QRS with a normal PR, narrow QRS, and a normal ST-T — this is normal sinus rhythm." That single sentence is a complete interpretation, and it took six quick checks. Every abnormal rhythm you will ever read is just this same sentence with one or two findings changed.
Now imagine one variable flips. Same strip, but the R-R spacing is chaotic and the P waves vanish into a wavy baseline: the rate line still works via the 6-second method, but steps 2 and 3 now read 'irregularly irregular, no discernible P waves,' and you are looking at atrial fibrillation. Change step 5 to 'wide' with a fast rate and you are on the ventricular tachycardia branch. The framework never changes — only the answers do.
Spotting the ST Segment and Dangerous Findings
Rate and rhythm handle most strips, but the ST-T analysis in step six is where you catch the emergencies. The ST segment should sit on the baseline. When it rides above the baseline across contiguous leads, that pattern of ST elevation can signal an acute, artery-occluding heart attack — a STEMI — and it is one of the few ECG findings that triggers the clock on a life-saving intervention.
On a 12-lead, the pattern of ST changes tells you which artery and which wall are involved, because each lead group looks at a specific territory. That localization is the heart of our STEMI ECG interpretation and 12-lead interpretation pages, and it connects the tracing back to the anatomy in our coronary artery anatomy guide. Recognizing it fast is what routes a patient toward the cardiac cath lab for reperfusion.
A short list of findings that should stop you cold, even as a beginner:
- ST elevation in contiguous leads — possible acute infarction; a time-critical emergency.
- Wide, fast, regular complexes — assume ventricular tachycardia.
- A chaotic, no-QRS baseline in an unresponsive patient — possible ventricular fibrillation.
- A very long QT — risk of torsades de pointes.
- Complete dissociation of P waves and QRS — complete (third-degree) heart block.
Understanding why these matter often means connecting the electrical picture to the underlying disease — for the ischemic patterns, our overviews of myocardial infarction and coronary artery disease fill in the pathophysiology behind the ST changes.
Building Skill: Practice and Common Pitfalls
ECG reading is a pattern-recognition skill, and pattern recognition is built by volume. The single most effective thing a beginner can do is read many strips with immediate feedback, always applying the same six steps. Our targeted RCIS ECG practice questions and the strip identification set are designed exactly for that loop, and the normal ECG interpretation page trains your eye on what 'normal' really looks like so deviations jump out.
A few pitfalls trip up nearly everyone at the start:
- Skipping calibration. Half-standard voltage or a non-standard paper speed silently corrupts every measurement. Check it first, every time.
- Box-counting an irregular rhythm. The 300 and 1500 rules only work when R-R is constant. Use the 6-second method otherwise.
- Trusting the machine's read. Automated interpretations miss and over-call; treat them as a hint, never the answer.
- Mistaking artifact for a rhythm. Muscle tremor, a loose lead, or movement can mimic scary rhythms. If the patient looks fine and a rhythm looks impossible, suspect artifact and check the leads.
- Reading in random order. Improvising the sequence is how you miss the P waves or the subtle ST change. Fixed order, every strip.
For those preparing for the credential specifically, ECG questions sit alongside hemodynamics and pharmacology on the blueprint — the ECG guide and the broader hemodynamics guide tie the electrical picture to pressures and flow, which is how the exam likes to test integrated understanding. Career-minded readers exploring roles that lean on these skills can see where they fit in our overview of the cardiovascular technologist path.
Key Takeaways
- Read every ECG with the same fixed sequence: rate, rhythm, P waves, PR, QRS, ST-T/QT. Consistency is the whole game.
- Master the grid first — small box = 0.04 s, large box = 0.20 s — and confirm speed (25 mm/s) and calibration (10 mm/mV) before measuring anything.
- Find rate with the 300 rule or 1500 rule for regular rhythms and the 6-second method for irregular ones.
- Anchor everything to normal sinus rhythm; you diagnose abnormal rhythms by how they deviate from it.
- A wide QRS points to the ventricles or abnormal conduction; an irregularly irregular rhythm without P waves suggests atrial fibrillation.
- The ST-T check catches emergencies — ST elevation across contiguous leads can mean an acute infarction.
- Build skill through high-volume practice with feedback, and avoid the classic traps: skipping calibration, box-counting irregular rhythms, and trusting the machine's read.
- This is educational content for RCIS preparation, not medical advice.
Frequently asked questions
How do I read an ECG step by step as a beginner?
Use a fixed six-step routine on every tracing: (1) rate — is it slow, normal, or fast; (2) rhythm — regular or irregular; (3) P waves — is there one upright P before every QRS; (4) PR interval — is it 120–200 ms; (5) QRS — narrow or wide; and (6) ST-T and QT — is the ST at baseline and the QT reasonable. Reading in the same order every time is what makes the skill reliable.
What does each small box on ECG paper mean?
At the standard paper speed of 25 mm per second, each small box (1 mm) equals 0.04 seconds horizontally and 0.1 mV vertically. A large box is five small boxes, so it equals 0.20 seconds and 0.5 mV. These values are the basis for every ECG measurement, so always confirm the paper speed and calibration first.
How do you calculate heart rate on an ECG?
For a regular rhythm, use the 300 rule: divide 300 by the number of large boxes between two R waves (memorize 300, 150, 100, 75, 60, 50). For a precise number, use the 1500 rule: divide 1500 by the number of small boxes between R waves. For an irregular rhythm, count the QRS complexes in a 6-second strip and multiply by 10.
What is normal sinus rhythm?
Normal sinus rhythm is the reference pattern: a regular rhythm at 60–100 beats per minute with an upright P wave before every QRS, a normal PR interval of 120–200 ms, and a narrow QRS under 120 ms. You diagnose most abnormal rhythms by noticing how they deviate from this baseline.
What is the difference between the P wave, QRS complex, and T wave?
The P wave represents atrial depolarization (the atria contracting), the QRS complex represents ventricular depolarization (the ventricles contracting — the large spike), and the T wave represents ventricular repolarization (the ventricles recovering). Reading them in that order, along with the intervals between, is the heart of ECG interpretation.
How can you tell if a QRS complex is wide?
A normal QRS is under 120 milliseconds, which is under three small boxes at standard speed. If the QRS spans more than three small boxes, it is 'wide,' meaning the ventricles were activated abnormally — either from a ventricular origin or from abnormal conduction such as a bundle branch block. A wide, fast, regular rhythm should be treated as ventricular tachycardia until proven otherwise.
What does ST elevation on an ECG mean?
ST elevation is when the ST segment rides above the baseline. When it appears across contiguous leads in the right clinical setting, it can signal an acute, artery-occluding heart attack (a STEMI), which is a time-critical emergency that often routes the patient straight to the cath lab. ST changes must always be interpreted with the whole clinical picture, not in isolation.
Can I rely on the ECG machine's automatic interpretation?
No. Automated ECG interpretations are a helpful hint but are frequently wrong — they over-call and miss findings. Always read the tracing yourself using a systematic method and correlate it with the patient. A normal automated read never rules out serious disease on its own.
How long does it take to learn to read an ECG?
You can learn the systematic framework and recognize common rhythms in a few focused sessions, but fluent, fast interpretation comes from reading a high volume of strips with feedback over weeks to months. The fastest path is to apply the same six steps to many practice tracings until the common patterns become automatic.
Sources & further reading
- Cardiovascular Credentialing International (CCI)
- American College of Cardiology
- American Heart Association
- MedlinePlus (U.S. National Library of Medicine)
External links are provided for reference; always confirm current details with the official source.