RCIS Hemodynamics Study Guide
The highest-yield RCIS topic, distilled — normal values, waveforms, shunts, and cardiac output, with practice questions to lock it in.
- Quick facts
- What you will learn
- Normal hemodynamic values to memorise
- Pressure tracings, chamber by chamber
- Atrial waveforms: a, c, and v waves
- Cardiac output: Fick and thermodilution
- Detecting shunts with an oxygen step-up
- Valve gradients and valve area
- Classic pathology waveforms (side by side)
- Exam tips
- Summary & key takeaways
Quick facts
- Definition: hemodynamics is the study of blood pressure and flow through the heart and vessels — the core of invasive cath-lab measurement.
- Highest-yield RCIS domain: expect heavy testing on normal values, waveform identification, cardiac output, shunts, and valve gradients.
- Normal mean RA 2–6 · PCWP 4–12 · PA 15–30/8–15 · LV 100–140/3–12 mmHg.
- Cardiac output 4–8 L/min; cardiac index 2.5–4.0 L/min/m².
- Golden rule: know the values cold — most waveform and pathology questions build on them.
What you will learn
- Recall normal pressures and resistances throughout the heart and great vessels.
- Identify each pressure tracing and the a, c, and v waves.
- Calculate and compare cardiac output by the Fick and thermodilution methods.
- Detect intracardiac shunts from an oxygen step-up.
- Recognise the classic waveforms of tamponade, constriction, stenosis, and regurgitation.
Normal hemodynamic values to memorise
These are the numbers the RCIS exam expects you to know without hesitation. Pressures are in mmHg unless noted.
| Site | Normal value | Note |
|---|---|---|
| Right atrium (mean) | 2–6 | ≈ central venous pressure |
| Right ventricle | 15–30 / 2–8 | diastole near zero |
| Pulmonary artery | 15–30 / 8–15 (mean 10–20) | dicrotic notch = pulmonic closure |
| PCWP (wedge) | 4–12 | ≈ left atrial pressure |
| Left atrium (mean) | 4–12 | — |
| Left ventricle | 100–140 / 3–12 | LVEDP reflects filling |
| Aorta | 100–140 / 60–90 (mean 70–105) | dicrotic notch = aortic closure |
| Cardiac output | 4–8 L/min | — |
| Cardiac index | 2.5–4.0 L/min/m² | CO ÷ BSA |
| SVR | 800–1200 dynes·s·cm⁻⁵ | systemic afterload |
| PVR | < 250 dynes·s·cm⁻⁵ (≈ < 2.5 Wood units) | pulmonary afterload |
Pressure tracings, chamber by chamber
Each chamber has a signature tracing. Learn the shape, not just the number — that is what image-based questions test.
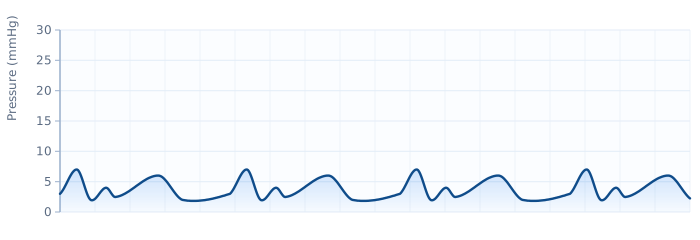
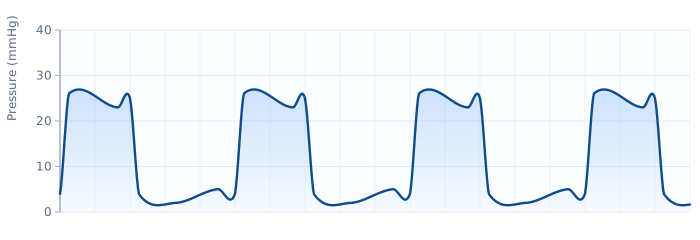
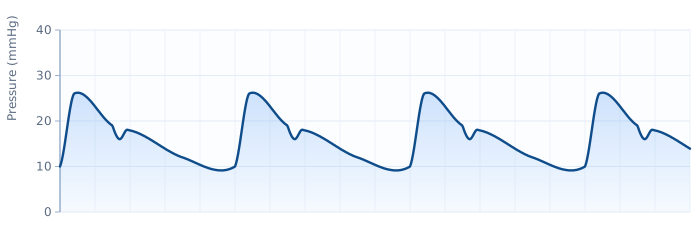
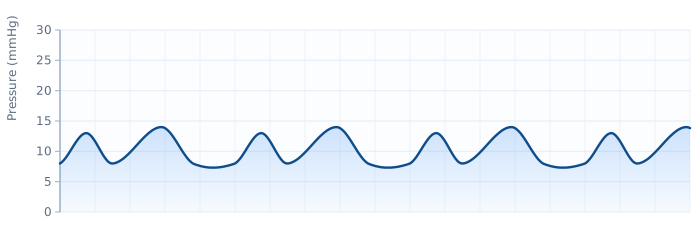
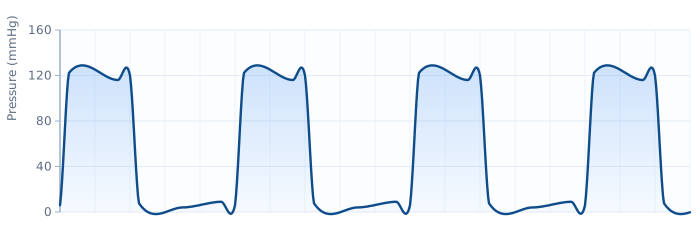
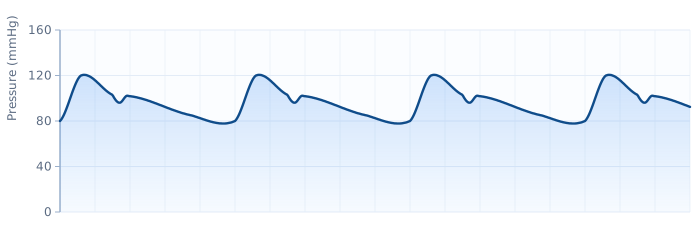
Try to name each on our pressure-waveform identification questions.
Atrial waveforms: a, c, and v waves
Atrial (RA and wedge) tracings have three positive waves and two descents. Tie each to the cardiac cycle:
| Component | Cause |
|---|---|
| a wave | Atrial contraction (follows the P wave) |
| c wave | AV valve bulging into the atrium in early systole |
| x descent | Atrial relaxation |
| v wave | Atrial filling against a closed AV valve (late systole) |
| y descent | Early diastolic emptying when the AV valve opens |
Abnormal patterns you must recognise
| Finding | Meaning |
|---|---|
| Absent a wave | Atrial fibrillation |
| Large (cannon) a wave | AV dissociation / complete heart block, tricuspid stenosis, pulmonary hypertension |
| Large v wave | Mitral regurgitation (wedge) or tricuspid regurgitation (RA) |
| Prominent x and y (M or W shape) | Constrictive pericarditis |
| Blunted y descent | Cardiac tamponade |
| Dip-and-plateau (square-root sign) | Constriction or restriction |
Cardiac output: Fick and thermodilution
Two methods dominate the exam.
Fick method
Based on oxygen uptake: CO = O₂ consumption ÷ (arteriovenous O₂ difference). Oxygen consumption is often assumed at ~125 mL/min/m². It is most accurate in low-output states.
Thermodilution
A cold saline bolus is injected into the right atrium and a thermistor in the pulmonary artery records the temperature–time curve; output is inversely proportional to the area under that curve. It is quick and common but unreliable in low output, tricuspid regurgitation, or intracardiac shunts — the settings where Fick wins.
Detecting shunts with an oxygen step-up
A left-to-right shunt dumps oxygenated blood into the right heart, producing an oxygen saturation step-up. Where the step-up appears localises the defect:
| Step-up location | Likely shunt |
|---|---|
| Right atrium | Atrial septal defect (ASD) |
| Right ventricle | Ventricular septal defect (VSD) |
| Pulmonary artery | Patent ductus arteriosus (PDA) |
The shunt's size is expressed as the Qp:Qs ratio (pulmonary : systemic flow); a ratio > 1.5–2.0 is generally significant.
Valve gradients and valve area
A stenotic valve creates a pressure gradient across it during the flow phase:
- Aortic stenosis — a systolic gradient between the LV and the aorta (measured on simultaneous LV–aortic pullback).
- Mitral stenosis — a diastolic gradient between the wedge (LA) and the LV.
Valve area is estimated from flow and gradient with the Gorlin formula; the simplified Hakki equation approximates aortic valve area as CO ÷ √(peak gradient). Severe aortic stenosis also gives the arterial tracing a slow, delayed upstroke — pulsus parvus et tardus with an anacrotic notch.
Classic pathology waveforms (side by side)
Three constrictive/restrictive look-alikes are a favourite exam trap. Compare them directly:
| Feature | Tamponade | Constriction | Restriction |
|---|---|---|---|
| Diastolic pressures | Equalised | Equalised | Elevated, LV often > RV |
| y descent | Blunted | Prominent | Prominent |
| Square-root sign | No | Yes | Yes |
| Pulsus paradoxus | Yes | Sometimes | No |
| Kussmaul sign | No | Yes | Sometimes |
Exam tips
- Memorise normal values until they are automatic — everything else builds on them.
- On a tracing, first decide venous vs ventricular vs arterial, then use the dicrotic notch and diastolic level to pin the exact site.
- Fick is best in low output; thermodilution fails in low output, TR, and shunts.
- Systolic gradient → aortic; diastolic gradient → mitral.
- Blunted y = tamponade; prominent x and y = constriction.
Summary & key takeaways
- Hemodynamics is the highest-yield RCIS domain — start here.
- Know the normal pressures, cardiac output/index, and SVR/PVR cold.
- Identify tracings by shape (a/c/v waves, dicrotic notch), not just numbers.
- Fick vs thermodilution: choose by the clinical setting.
- Oxygen step-up localises shunts; gradients quantify valve disease.
- Tamponade, constriction, and restriction are distinguished by the y descent and Kussmaul/pulsus signs.
Drill hemodynamics now
Practise hemodynamics questions with instant feedback and explanations.
Practise Hemodynamics →Frequently asked questions
What is the normal PCWP?
4–12 mmHg. It approximates left atrial pressure and reflects left ventricular filling pressure.
What does a large v wave indicate?
Severe mitral regurgitation, because regurgitant flow fills the left atrium during ventricular systole.
What are normal cardiac output and cardiac index?
Cardiac output is 4–8 L/min and cardiac index (output divided by body surface area) is 2.5–4.0 L/min/m².
When is the Fick method preferred over thermodilution?
Fick is more accurate in low-output states and when tricuspid regurgitation or an intracardiac shunt is present, all of which make thermodilution unreliable.
How do you tell a pulmonary artery tracing from a right ventricular one?
The pulmonary artery tracing has an elevated diastolic pressure and a dicrotic notch, whereas the right ventricular diastole falls back toward zero with no notch.
What waveform finding suggests cardiac tamponade?
A blunted y descent with equalisation of diastolic pressures and pulsus paradoxus is classic for tamponade.
Sources & further reading
- Cardiovascular Credentialing International (CCI)
- American College of Cardiology
- American Heart Association
- MedlinePlus (U.S. National Library of Medicine)
External links are provided for reference; always confirm current details with the official source.