STEMI ECG Interpretation
A STEMI is the most time-critical pattern in all of electrocardiography, and reading it correctly in seconds — not minutes — is what reopens an artery before muscle turns to scar. This guide walks through ST-elevation criteria, how to localize the culprit vessel, why reciprocal change matters, and the mimics that trip people up.
- What a STEMI is — and why the ECG is the trigger
- ST-elevation criteria: how much is enough?
- Localizing the culprit artery
- Reciprocal change: the confirming mirror
- Special patterns you can't afford to miss
- The LBBB and paced-rhythm problem
- STEMI mimics: elevation that isn't infarction
- A systematic approach at the bedside
- Key takeaways
What a STEMI is — and why the ECG is the trigger
A STEMI — ST-Elevation Myocardial Infarction — is a heart attack in which a coronary artery is completely occluded, so the full thickness of the muscle wall it feeds is losing its blood supply. The electrocardiogram is not just a supporting test here; it is the decision-maker. In the world of acute coronary syndromes, the 12-lead ECG is what pulls a patient out of the waiting room and into the cath lab, because ST elevation is treated as direct evidence that an artery is shut and reperfusion cannot wait.
That is the whole reason STEMI ECG interpretation carries such weight on the RCIS exam and in real practice. A missed STEMI is missed muscle. Recognizing the pattern — and distinguishing it from the many benign look-alikes — is a core competency for anyone in a cardiac cath lab. The mechanism behind the tracing is a ruptured plaque with a clot sealing the vessel; if you want the pathophysiology in full, our overview of myocardial infarction lays out the chain from plaque to infarct.
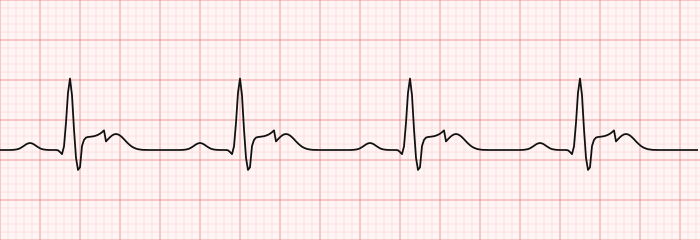
One framing worth internalizing early: ST elevation reflects a wave of injury across the full thickness of the wall. Because that injury current is directional, the leads that "see" the injured wall show elevation, while leads looking at it from the opposite side often show the mirror image — depression. That directional logic is the key to everything that follows, from localization to spotting reciprocal change.
This article is educational and written for exam preparation and clinical learning. It is not medical advice, and no ECG rule replaces bedside judgment or local protocol.
ST-elevation criteria: how much is enough?
Not every raised ST segment is a STEMI. Guidelines define specific ST elevation criteria so that real occlusions are caught without over-calling normal variants. The measurement is taken at the J point — the junction where the QRS ends and the ST segment begins — and compared against the isoelectric baseline, best judged from the TP or PR segment. New elevation in two anatomically contiguous leads is the threshold; a single lead is never enough on its own.
The current fourth-universal-definition thresholds most commonly taught are:
| Leads | Threshold at the J point | Notes |
|---|---|---|
| V2–V3, men <40 years | ≥ 2.5 mm | Younger men have higher normal baseline elevation |
| V2–V3, men ≥40 years | ≥ 2.0 mm | |
| V2–V3, women (all ages) | ≥ 1.5 mm | Lower threshold than men |
| All other leads | ≥ 1.0 mm | In two contiguous leads |
| V3R–V4R (right-sided) | ≥ 0.5 mm (≥ 1.0 mm men <30) | For right ventricular infarction |
| V7–V9 (posterior) | ≥ 0.5 mm | For true posterior infarction |
"Contiguous" means neighboring leads that view the same region: the inferior group (II, III, aVF), the anterior/septal group (V1–V4), and the lateral group (I, aVL, V5–V6). The gender- and age-adjusted V2–V3 numbers exist because the anterior precordial leads normally sit a little elevated, especially in young men, and applying a flat 1 mm rule there would flag countless healthy tracings.
Shape matters too. Early on, ST elevation can be subtle and up-sloping, sometimes with tall, broad "hyperacute" T waves before the segment fully lifts. As the infarct evolves the elevation becomes convex ("tombstone" or domed) and the T wave inverts. A convex, dome-shaped elevation that merges into the T wave is far more worrying than the concave, smiley-shaped elevation of benign early repolarization. Building this pattern recognition sits on top of solid ECG interpretation fundamentals.
Localizing the culprit artery
One of the most elegant things about the 12-lead is that it does not just say "STEMI" — it points at the artery. Because each lead looks at the heart from a fixed angle, the pattern of ST elevation tells you which wall is infarcting, and each wall has a dominant coronary supply. That is the essence of localizing the culprit artery, and it maps directly onto coronary artery anatomy.
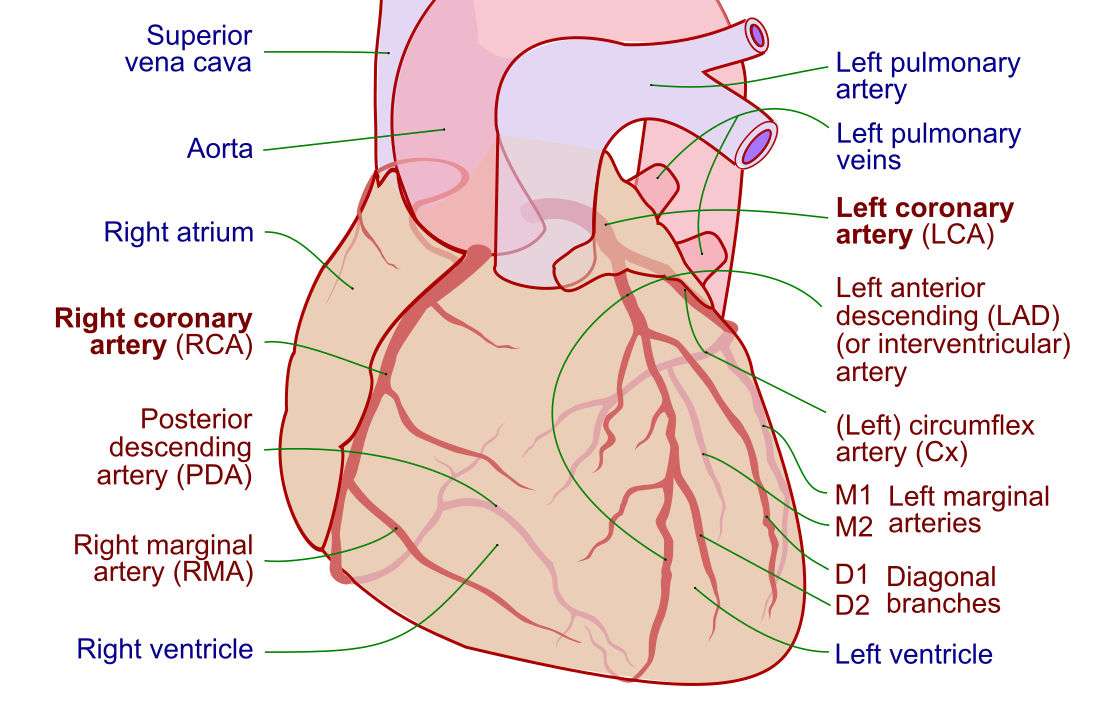
The core map is worth committing to memory cold:
| Territory | Leads with ST elevation | Usual culprit artery | Reciprocal changes |
|---|---|---|---|
| Inferior | II, III, aVF | Right coronary artery (RCA)* | I, aVL |
| Anteroseptal | V1–V2 | LAD (proximal / septal branches) | Usually none |
| Anterior | V3–V4 | Left anterior descending (LAD) | II, III, aVF (if extensive) |
| Anterolateral / extensive anterior | V1–V6, I, aVL | Proximal LAD | II, III, aVF |
| Lateral | I, aVL, V5–V6 | Circumflex or diagonal | II, III (high lateral) |
| Posterior | V7–V9 (tall R + ST depression V1–V3) | RCA or circumflex | Anterior depression is the mirror |
| Right ventricular | V4R (and V1) | Proximal RCA | — |
*In right-dominant circulation (~85% of people), the inferior wall is fed by the RCA; in left-dominant hearts the circumflex supplies it. Dominance simply refers to which artery gives off the posterior descending branch.
A few clinical anchors make the table stick. A proximal LAD occlusion — the so-called "widowmaker" — lights up the anterior leads and can knock out a huge slab of left ventricle, which is why anterior STEMIs carry the worst prognosis and the highest risk of pump failure and cardiogenic shock. Inferior STEMIs from the RCA are more likely to involve the SA and AV nodal supply, so they bring bradycardia and AV block, and their vagal tone can drop the blood pressure sharply. Understanding which wall is failing also predicts the hemodynamic fallout, a theme that runs through our hemodynamics guide.
Reciprocal change: the confirming mirror
If localization is the map, reciprocal change is the compass that confirms you are reading a real infarct. Reciprocal changes are ST-segment depressions seen in leads that view the injured wall from the opposite direction — the electrical mirror image of the elevation. When an artery is truly occluded, the injury current points toward the affected wall, so leads on the far side record it as a downward deflection.
Why does this matter so much? Because the presence of reciprocal depression dramatically raises the odds that ST elevation represents genuine occlusion rather than a benign mimic. Pericarditis, early repolarization, and left ventricular hypertrophy can all elevate ST segments, but they rarely produce clean reciprocal depression in an anatomically opposite territory. Reciprocal change is one of the strongest tie-breakers you have at the bedside.
- Inferior STEMI (II, III, aVF) → reciprocal depression in I and aVL. This is the most reliable and most tested pairing.
- High lateral STEMI (I, aVL) → reciprocal depression in II, III, aVF.
- Anterior STEMI → may show reciprocal depression inferiorly when the occlusion is proximal and extensive.
- Posterior STEMI → horizontal ST depression in V1–V3 with tall R waves is itself the reciprocal picture of posterior elevation you cannot see on a standard 12-lead.
Reciprocal change also carries prognostic weight. Its presence, particularly anterior depression accompanying an inferior STEMI, suggests a larger area at risk and a more proximal occlusion. That is one more reason to always scan the whole tracing rather than fixating on the leads that first caught your eye — a discipline we reinforce throughout our rhythm interpretation material.
Special patterns you can't afford to miss
Some occlusions do not announce themselves with textbook anterior or inferior elevation. These are the patterns that separate a confident reader from a hesitant one, and they show up disproportionately on exams precisely because they are missed in the wild.
Posterior STEMI. The standard 12-lead has no lead sitting behind the heart, so a posterior infarct appears as its mirror image: horizontal ST depression in V1–V3, tall broad R waves, and upright T waves. Confirm it by placing posterior leads V7–V9 and looking for ≥0.5 mm elevation. Isolated anterior ST depression should always prompt the thought, "is this actually a posterior STEMI?"
Right ventricular infarction. Suspect it whenever you see an inferior STEMI, because the proximal RCA feeds both. Record right-sided leads and look for elevation in V4R. This changes management: these patients are preload-dependent, so nitrates can cause dangerous hypotension. This is exactly the kind of scenario where knowing the pharmacology and cautions of nitroglycerin is genuinely life-saving.
Wellens' syndrome. Deeply biphasic or symmetrically inverted T waves in V2–V3, typically when the patient is pain-free, signal a critical proximal LAD stenosis. It is not an active STEMI, but it warns of an imminent large anterior infarct and demands angiography, not a stress test.
De Winter T waves. Up-sloping ST depression at the J point in the precordial leads with tall, symmetric T waves — a STEMI-equivalent that indicates acute proximal LAD occlusion despite the absence of frank ST elevation.
Left main / proximal LAD. Widespread ST depression with ST elevation in aVR (greater than in V1) suggests severe left main or triple-vessel disease — a high-risk pattern pointing toward the operating room as often as the cath lab.
Hyperacute T waves. Before the ST segment lifts, the earliest change may be tall, broad, symmetric T waves. Catching this phase buys precious time.
The LBBB and paced-rhythm problem
Left bundle branch block and ventricular pacing both scramble the QRS and the ST–T segments, producing baseline ST elevation and depression that have nothing to do with ischemia. For decades a new LBBB was treated as a STEMI-equivalent, but current guidance is more nuanced: a new or presumed-new LBBB in a patient with a convincing ischemic story still warrants urgent evaluation, yet LBBB by itself is no longer an automatic cath-lab activation.
The tool that cuts through the confusion is the Sgarbossa criteria, which look for ST changes that are disproportionate to the abnormal QRS:
| Criterion | Points |
|---|---|
| Concordant ST elevation ≥ 1 mm (same direction as QRS) | 5 |
| Concordant ST depression ≥ 1 mm in V1–V3 | 3 |
| Excessively discordant ST elevation ≥ 5 mm (opposite the QRS) | 2 |
A score of 3 or more is specific for infarction. The modified (Smith) Sgarbossa rule replaces the fixed 5 mm cutoff with a proportion — discordant ST elevation ≥ 25% of the preceding S-wave depth — which improves sensitivity. The same logic applies to right-ventricular paced rhythms, since a pacemaker creates an LBBB-like morphology. Anyone working around devices benefits from understanding how a pacemaker and the underlying cardiac conduction system shape the surface ECG.
STEMI mimics: elevation that isn't infarction
Perhaps the hardest skill in STEMI reading is knowing when not to call one. A long list of conditions elevate the ST segment, and activating the cath lab for a mimic carries its own risks. The differential for these mimics is a favorite exam target.
| Mimic | Distinguishing features |
|---|---|
| Pericarditis | Diffuse, concave ("saddle") ST elevation across many territories; PR depression; PR elevation in aVR; no reciprocal change; positional, pleuritic pain |
| Benign early repolarization | Concave elevation, notched or slurred J point ("fish-hook"), prominent T waves; stable over time; young, healthy patients |
| Left ventricular hypertrophy | High QRS voltages with discordant ST elevation in V1–V3 (strain pattern); elevation is proportional to deep S waves |
| Left bundle branch block / paced | Discordant ST–T changes; apply Sgarbossa criteria |
| Brugada pattern | Coved ST elevation in V1–V2 with a specific morphology; a genetic channelopathy, not ischemia |
| Hyperkalemia | Peaked T waves, widened QRS, ST changes; check the potassium |
| Takotsubo (stress) cardiomyopathy | Anterior ST elevation mimicking LAD occlusion but with clean coronaries on angiography; emotional/physical trigger |
| Early repolarization vs. injury | Concave (smiley) favors benign; convex (frowny) favors infarction |
The single most useful discriminator is the company the elevation keeps. Infarction is regional and usually paired with reciprocal depression; pericarditis is diffuse and lacks it. Serial tracings are your friend — genuine STEMI evolves over minutes to hours, while benign early repolarization stays put. When the tracing is ambiguous and the story is convincing, err toward treating it as an occlusion, but let the whole clinical picture, prior ECGs, and bedside echo inform the call. Our broader coronary artery disease overview gives useful context on which patients carry the pretest risk that tips a borderline call.
A systematic approach at the bedside
Under pressure, a repeatable routine beats pattern-spotting by instinct. Here is a defensible sequence for reading any tracing where STEMI is on the table:
- Rate and rhythm first. Ischemia is arrhythmogenic — scan for ventricular tachycardia, high-grade block, or bradycardia before anything else.
- Find the isoelectric baseline using the TP segment, then measure ST deviation at the J point.
- Group the leads by territory — inferior, anterior/septal, lateral — and ask whether elevation meets the contiguous-lead threshold.
- Hunt for reciprocal change. Its presence strongly supports infarction; its absence should make you reconsider a mimic.
- Assess the shape. Convex/domed and merging into the T wave is ominous; concave with a notched J point leans benign.
- Handle confounders. Is there LBBB or pacing? Apply Sgarbossa. Is there isolated anterior depression? Get posterior leads. Inferior STEMI? Get right-sided leads.
- Compare with a prior ECG if one exists, and repeat the tracing if the picture is evolving.
For anyone drilling this for the credential, a structured review of the ECG guide paired with hands-on ECG strip practice builds the speed that a real activation demands. The goal is to reach a point where the sequence runs automatically, so your conscious attention is free for the judgment calls — the ambiguous shapes, the borderline mimics, the sick patient whose ECG looks deceptively calm.
Every improvement in reading speed and accuracy translates into shorter door-to-balloon times, which is the whole point. The ECG is where the clock starts.
Key takeaways
- A STEMI reflects complete coronary occlusion and transmural injury; on the ECG it appears as ST-segment elevation, and it is the ECG — not the troponin — that triggers emergency reperfusion.
- ST elevation criteria require new elevation in two contiguous leads, measured at the J point, with age- and sex-adjusted thresholds in V2–V3 (2.5 mm in younger men, 2.0 mm in older men, 1.5 mm in women, 1.0 mm elsewhere).
- Localizing the culprit artery follows lead groups: inferior (II, III, aVF) = RCA; anterior (V1–V6) = LAD; lateral (I, aVL, V5–V6) = circumflex or diagonal.
- Reciprocal change — ST depression in the opposite territory, classically I and aVL for inferior STEMI — confirms genuine infarction and helps separate it from mimics.
- Do not miss the sneaky patterns: posterior STEMI (anterior depression + posterior leads), right ventricular infarction (V4R), Wellens', de Winter, and aVR elevation for left main disease.
- Use Sgarbossa criteria to read STEMI through LBBB or a paced rhythm, keying on ST changes that are concordant or disproportionate.
- Common mimics include pericarditis (diffuse, no reciprocal change), benign early repolarization, LVH strain, Brugada, hyperkalemia, and Takotsubo — regional elevation with reciprocal change favors true infarction.
- This content is educational, not medical advice; local protocol and bedside judgment always govern real activations.
Frequently asked questions
What defines a STEMI on the ECG?
A STEMI is defined by new ST-segment elevation in at least two anatomically contiguous leads, measured at the J point relative to the isoelectric baseline. The thresholds are 1 mm in most leads, and in V2-V3 they are adjusted by age and sex: 2.5 mm in men under 40, 2.0 mm in men 40 and older, and 1.5 mm in women. Genuine STEMI is usually accompanied by reciprocal ST depression and evolves over time.
How do you localize the culprit artery from the ECG?
Group the leads by the wall they view. ST elevation in II, III, and aVF points to the inferior wall, usually the right coronary artery. Elevation in V1-V4 points to the anterior/septal wall supplied by the left anterior descending artery. Elevation in I, aVL, V5, and V6 points to the lateral wall, supplied by the circumflex or a diagonal branch. The pattern of leads maps directly onto coronary anatomy.
What are reciprocal changes and why do they matter?
Reciprocal changes are ST-segment depressions seen in leads that view the injured wall from the opposite direction — the electrical mirror image of the ST elevation. They matter because their presence strongly supports a true occlusion rather than a benign mimic. The classic example is reciprocal depression in leads I and aVL during an inferior STEMI, which can even appear before the inferior elevation becomes obvious.
What conditions mimic a STEMI on the ECG?
Common STEMI mimics include acute pericarditis (diffuse concave elevation with PR depression and no reciprocal change), benign early repolarization, left ventricular hypertrophy with strain, left bundle branch block or paced rhythms, Brugada pattern, hyperkalemia with peaked T waves, and Takotsubo (stress) cardiomyopathy. The key discriminators are whether the elevation is regional versus diffuse, whether reciprocal change is present, and whether the tracing evolves over serial ECGs.
How much ST elevation is significant?
Significant elevation is at least 1 mm above baseline in two contiguous leads for most leads. In V2-V3 the cutoffs are higher because these leads are normally slightly elevated: 2.5 mm in men under 40, 2.0 mm in men 40 or older, and 1.5 mm in women of any age. Posterior leads (V7-V9) and right-sided leads (V4R) use a lower 0.5 mm threshold. Elevation is always measured at the J point.
Can you diagnose a STEMI when there is a left bundle branch block?
Yes, but it takes extra scrutiny because LBBB distorts the ST segments on its own. The Sgarbossa criteria help: concordant ST elevation of at least 1 mm, concordant ST depression of at least 1 mm in V1-V3, or excessively discordant ST elevation of at least 5 mm suggest infarction. The modified Smith-Sgarbossa rule uses a proportion (discordant elevation at least 25% of the S-wave depth) for better sensitivity. A new LBBB with a convincing ischemic story still warrants urgent evaluation.
What is a posterior STEMI and how is it recognized?
A posterior STEMI involves the back wall of the heart, which no standard lead directly faces. It is recognized by its mirror image on the anterior leads: horizontal ST depression in V1-V3 with tall, broad R waves and upright T waves. To confirm it, posterior leads V7-V9 are placed, and ST elevation of at least 0.5 mm there is diagnostic. Isolated anterior ST depression should always raise suspicion for a posterior infarct.
Why does ST elevation in aVR matter?
ST elevation in lead aVR, especially when it exceeds elevation in V1 and is accompanied by widespread ST depression across the other leads, suggests severe left main coronary artery disease or triple-vessel disease. This is a high-risk pattern associated with a large area of myocardium at risk, and it often points toward surgical revascularization as much as urgent catheterization.
What is the difference between the ST elevation of a STEMI and early repolarization?
Shape and evolution are the main clues. STEMI elevation tends to be convex or domed (frowning) and merges into the T wave, and it changes over serial tracings as the infarct evolves. Benign early repolarization is concave (smiling) with a notched or slurred J point, is seen in young healthy people, and stays stable over time. STEMI is also regional with reciprocal change, whereas early repolarization lacks reciprocal depression.
Sources & further reading
- Cardiovascular Credentialing International (CCI)
- American College of Cardiology
- American Heart Association
- MedlinePlus (U.S. National Library of Medicine)
External links are provided for reference; always confirm current details with the official source.