12-Lead ECG Interpretation
A 12-lead ECG is twelve different camera angles on the same beating heart. Learn to read them together and you can pinpoint where the heart is starved, how it is oriented in the chest, and which artery is in trouble — often in under a minute.
What a 12-lead ECG actually shows
A 12-lead ECG is not twelve separate wires taped to twelve separate places. It is a clever piece of geometry: ten electrodes on the body generate twelve distinct electrical "views" of the heart, each looking at the muscle from a different direction. Six of those views (the limb leads) slice through the heart in a vertical, frontal plane; the other six (the chest leads) wrap around it in a horizontal plane. Put them together and you get a three-dimensional sense of electrical activity from a two-dimensional tracing.
That is the entire point of 12 lead ECG interpretation. A single rhythm strip tells you the rate and the rhythm — is it fast, slow, regular, chaotic. But it cannot tell you where a problem lives. Twelve leads can. When one wall of the heart loses its blood supply, only the leads facing that wall light up with the classic injury pattern, while leads on the opposite side often show a mirror-image change. Reading all twelve in concert is what turns "something is wrong" into "the inferior wall is infarcting, probably from the right coronary artery."
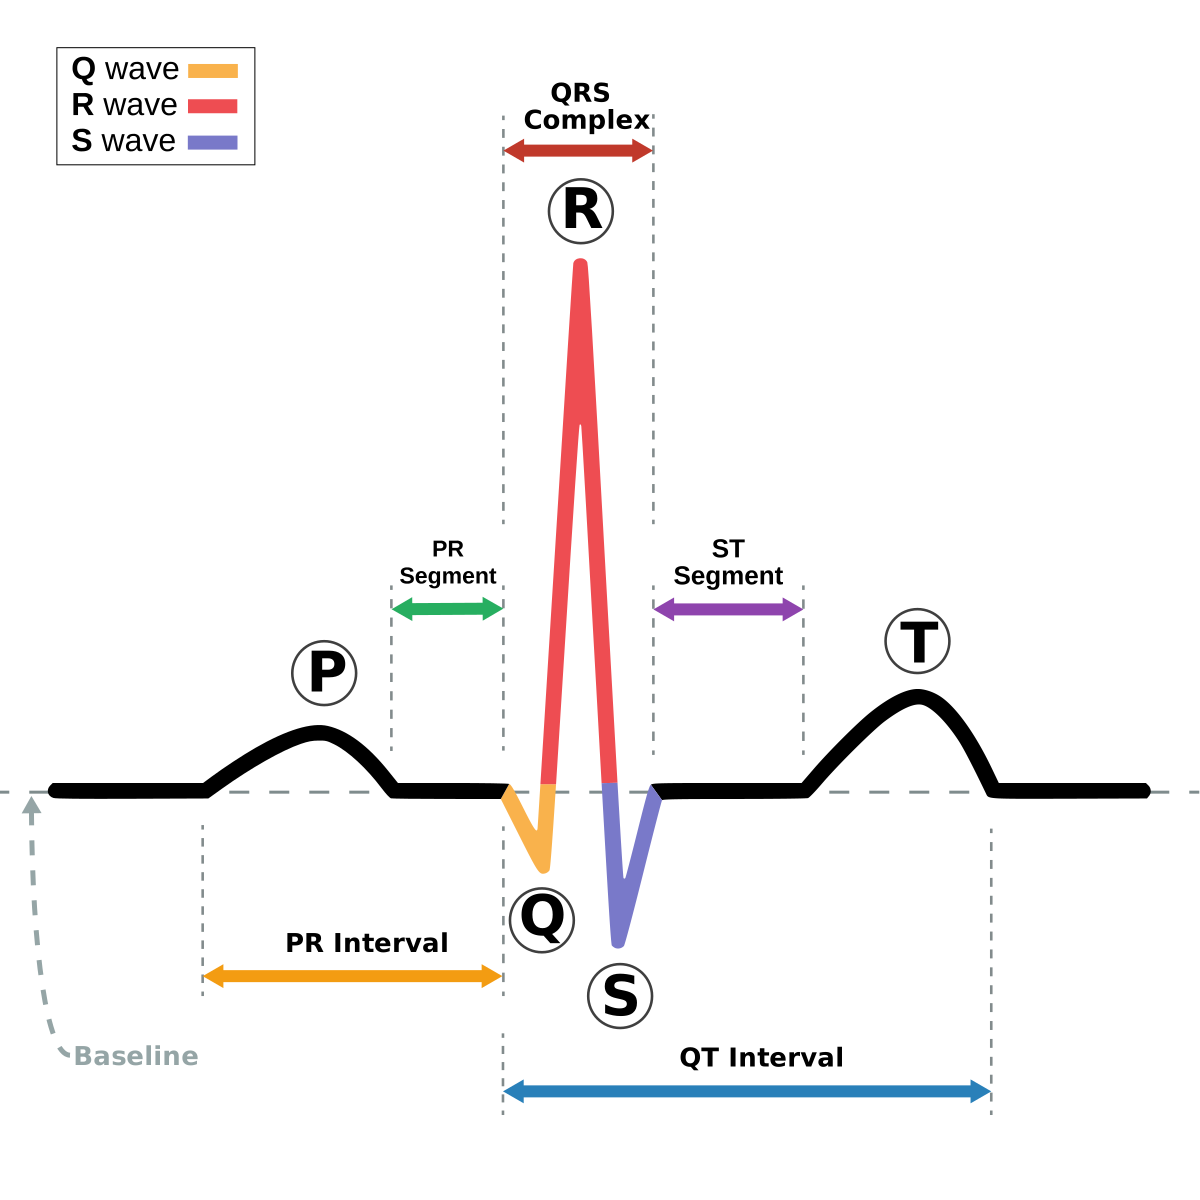
Before diving into territories and axis, it helps to have a firm grip on the building blocks of a single complex — the P wave, QRS, and T wave, and the intervals between them. If those are shaky, our foundational guide to ECG interpretation and the deeper RCIS ECG study guide are the right place to start. This article assumes you know a normal complex and focuses on squeezing localization and axis out of the full twelve leads.
This is educational material written for students and clinicians preparing for exams such as the RCIS. It is not medical advice, and no single article replaces supervised training and current institutional protocols.
A system for reading every 12-lead
The fastest readers are not the ones who "just see it." They are the ones who run the same checklist every single time, so nothing slips past them. Build the habit early and it becomes automatic. A reliable order looks like this:
- Rate — roughly 300 divided by the number of large boxes between beats, or count complexes on a 6-second strip and multiply by ten.
- Rhythm — regular or irregular, and is there a P wave before every QRS? For a structured walk through rhythms, see our overview of ECG rhythm interpretation.
- Axis — the overall direction of ventricular depolarization (covered in detail below).
- Intervals — PR, QRS width, and QT. A wide QRS, a long PR, or a prolonged QT interval each send you down a different path.
- Morphology and territories — hunt through the leads by wall: inferior, anterior/septal, lateral, and (with extra leads) right ventricle and posterior wall.
Only after that scan do you form an impression. Skipping straight to "is there a STEMI?" is how people miss a subtle first-degree block, an unexpected axis shift, or a dangerously long QT hiding behind an obvious finding.
The twelve leads and the two planes
To localize anything, you have to know which lead looks where. The twelve leads split into two families that view the heart in two perpendicular planes.
The six limb leads — I, II, III, aVR, aVL, and aVF — see the heart in the frontal (coronal) plane, as if you were standing in front of the patient. They are arranged around a hexagon of directions and are the leads you use to calculate axis. Leads II, III, and aVF point downward at the inferior wall; leads I and aVL point leftward and upward at the high lateral wall; aVR looks up toward the right shoulder and is often the ignored lead that quietly holds important clues.
The six chest (precordial) leads — V1 through V6 — see the heart in the horizontal (transverse) plane, as if sliced across the chest. They march from the right side of the sternum (V1, V2) across the septum and anterior wall (V3, V4) to the lateral wall (V5, V6). Because they sit right on the chest wall, they are exquisitely sensitive to problems in the muscle directly beneath them.
| Lead group | Leads | Plane | Chiefly views |
|---|---|---|---|
| Inferior limb | II, III, aVF | Frontal | Inferior wall |
| Lateral limb | I, aVL | Frontal | High lateral wall |
| Cavity lead | aVR | Frontal | Right upper heart / cavity |
| Septal chest | V1, V2 | Horizontal | Septum |
| Anterior chest | V3, V4 | Horizontal | Anterior wall |
| Lateral chest | V5, V6 | Horizontal | Low lateral wall |
Correct electrode placement matters more than beginners expect. A V1/V2 pair placed one interspace too high can fake a septal infarct pattern or a partial right bundle branch block. Precise, reproducible lead placement is a core competency for anyone training as a cardiovascular technologist or working in the cath lab, and it underpins everything that follows.
Leads and their territories
The heart of localization is a simple but powerful idea: each group of leads maps to a wall of the left ventricle, and each wall maps to a coronary artery. Memorize the leads territories table and roughly two-thirds of infarct localization is done.
| Territory (wall) | Leads | Usual coronary artery |
|---|---|---|
| Inferior | II, III, aVF | Right coronary artery (RCA) |
| Septal | V1, V2 | Left anterior descending (LAD), proximal |
| Anterior | V3, V4 | Left anterior descending (LAD) |
| Lateral | I, aVL, V5, V6 | Left circumflex (LCx) or diagonal branch |
| Posterior | V7–V9 (mirror in V1–V3) | RCA or LCx |
| Right ventricle | V3R–V6R (esp. V4R) | Proximal RCA |
A few nuances separate a competent reader from a great one. The inferior wall is fed by the RCA in most people, but in the roughly 10–15% who are "left-dominant," the circumflex supplies it instead — so an inferior pattern does not lock in the RCA with certainty. The lateral wall is genuinely split: leads I and aVL sit high on the wall, while V5 and V6 sit low, and the two can be involved separately. And the septum, being the shared border of both ventricles, is why proximal LAD lesions can be so devastating.
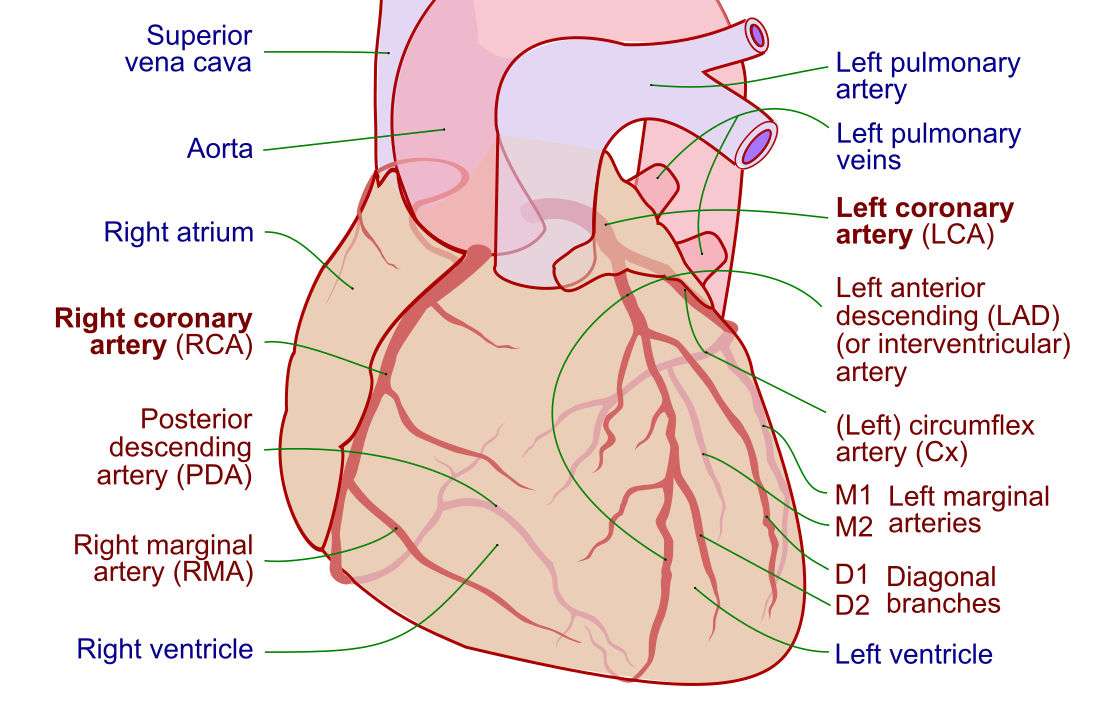
To make this map stick, it pays to know the plumbing it rests on. Our detailed page on coronary artery anatomy walks through dominance and branch patterns, and the broader cardiac anatomy guide ties the walls to chambers and valves. You can also drill the mapping directly with the RCIS ECG practice questions.
MI localization: finding the wall
Now the payoff. MI localization is the process of using the territory map to name the infarcting wall and predict the culprit artery. In a ST-elevation MI (STEMI), the injured wall produces ST-segment elevation in the leads that face it, and the pattern of which leads are elevated tells the story.
Work through it by pattern:
- Inferior STEMI — ST elevation in II, III, and aVF. Culprit is usually the RCA. Because the RCA also often feeds the right ventricle and the AV node, watch for low blood pressure, bradycardia, and heart block.
- Anterior / anteroseptal STEMI — ST elevation across V1–V4. Culprit is the LAD. A proximal LAD occlusion — the classic "widowmaker" — threatens a huge amount of muscle and pump function.
- Lateral STEMI — ST elevation in I, aVL, V5, and V6, from the circumflex or a diagonal branch. It frequently rides along with an inferior or anterior infarct rather than appearing alone.
- Posterior STEMI — sneaky, because standard leads do not face the back of the heart. You infer it from a mirror image in V1–V3 (tall R waves and ST depression) and confirm with posterior leads V7–V9.
- Right ventricular MI — suspect it in any inferior STEMI; confirm with right-sided lead V4R. It matters clinically because these patients are preload-dependent and can crash if given nitrates.
A whole page could be devoted to the STEMI patterns and their pitfalls — and one is: our dedicated walkthrough of STEMI ECG interpretation goes deeper on thresholds, equivalents, and mimics. For the bigger clinical picture of how these tracings translate into treatment, see the overview of myocardial infarction and its roots in coronary artery disease. Once a STEMI is called, the pathway usually runs to the cath lab; our comparison of PCI versus diagnostic catheterization explains what happens next.
Reciprocal changes and why they matter
One of the most reassuring confirmations in acute ECG reading is the concept of reciprocal changes. When one wall of the heart is injured and shows ST elevation, the leads looking at the opposite wall often show the mirror image — ST depression. It is the same electrical event viewed from the far side, like watching a wave from both shores.
Why care? Because reciprocal change dramatically raises your confidence that ST elevation is a true infarct rather than a benign look-alike. Early repolarization, pericarditis, and left ventricular hypertrophy can all mimic ST elevation, but they generally do not produce crisp reciprocal depression in the anatomically opposite leads. When you see elevation in one territory and matching depression in its mirror, the diagnosis of acute injury firms up considerably.
| Injury territory (ST elevation) | Reciprocal leads (ST depression) |
|---|---|
| Inferior (II, III, aVF) | I and aVL |
| Anterior (V1–V4) | Inferior leads (variable) |
| Lateral (I, aVL) | Inferior (II, III, aVF) |
| Posterior (V7–V9) | V1–V3 (tall R, ST depression) |
The posterior case is the most important to internalize, because it is the one situation where the reciprocal change is essentially your only clue on a standard 12-lead. Tall R waves with horizontal ST depression in V1–V3 — the mirror of a posterior injury — should prompt you to record posterior leads rather than shrug the depression off as anterior ischemia.
Determining the cardiac axis
The axis is the net direction the ventricles depolarize in the frontal plane — essentially, which way the heart's main electrical vector points. In a normal adult it aims down and to the patient's left, roughly between −30° and +90°. A shift out of that window is a clue, not a diagnosis, but it is a clue that frequently cracks a case open.
The quickest bedside method uses just two leads, I and aVF, and asks whether the net QRS in each is mostly positive or negative:
| Lead I | Lead aVF | Axis | Think about |
|---|---|---|---|
| Positive | Positive | Normal | Usually fine |
| Positive | Negative | Left axis deviation | Left anterior fascicular block, LVH, inferior MI |
| Negative | Positive | Right axis deviation | Right heart strain, lateral MI, tall/thin build, RVH |
| Negative | Negative | Extreme (northwest) axis | Consider lead misplacement, VT, hyperkalemia |
A slightly more precise trick is to find the limb lead in which the QRS is most equiphasic (equally positive and negative); the true axis lies roughly perpendicular to that lead. For most clinical purposes, though, the two-lead quadrant method is fast and good enough.
Axis matters because deviations track real pathology. Left axis deviation raises suspicion for a left anterior fascicular block or an old inferior infarct that has stolen forces from the inferior leads. Right axis deviation can flag right ventricular strain — think pulmonary embolism or chronic lung disease — or a lateral infarct. A sudden change in a patient's axis from a prior ECG is often more meaningful than the absolute number, which is one more reason to always compare with an old tracing when you can. To see how these electrical vectors arise from the wiring itself, revisit the cardiac conduction system.
Beyond MI: rhythm, blocks, and pitfalls
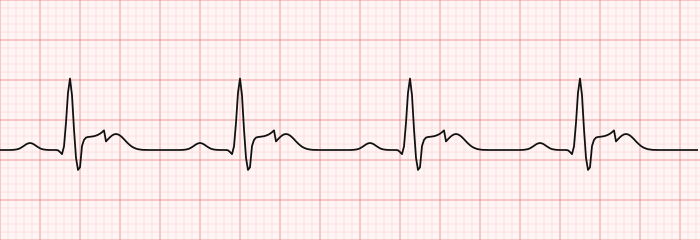
Localization and axis are the glamour skills, but a full 12 lead ECG interpretation also has to catch everything else the tracing is telling you. The 12-lead is often better than a single rhythm strip for sorting rhythms because a P wave invisible in one lead may be obvious in another.
Bundle branch blocks reshape the QRS and can mask or mimic ischemia. A left bundle branch block, in particular, distorts ST segments so much that diagnosing a STEMI through it requires special criteria rather than the usual elevation thresholds. Fascicular blocks show up mainly as axis shifts, tying this section back to the last. AV conduction problems — from a simple long PR to complete heart block — are read off the relationship between P waves and QRS complexes, and a paced rhythm from a pacemaker introduces spikes and a wide, LBBB-like QRS that again defeats ordinary STEMI criteria.
Chamber enlargement leaves fingerprints too: tall precordial voltages suggest left ventricular hypertrophy, while a dominant R wave in V1 with right axis deviation hints at right ventricular hypertrophy. Metabolic states matter — peaked T waves and a widening QRS raise the specter of hyperkalemia, and a long QT interval (whether from drugs, low potassium, or low magnesium) sets the stage for torsades de pointes. Many of these dovetail with rhythm recognition; sharpen that with the rhythm interpretation guide and the image-based ECG strip practice.
Finally, respect the common traps. Reversed limb leads can invent an axis or an infarct out of thin air; a high V1–V2 placement can fake septal changes; and artifact from tremor or a loose electrode can masquerade as a life-threatening arrhythmia. When a finding does not fit the clinical picture, re-check the leads before you act. Correlating the ECG with the patient — and often with an echocardiogram or hemodynamic data from the hemodynamics essentials — is what separates pattern-matching from genuine interpretation.
Key takeaways
- A 12-lead ECG gives twelve views of the heart in two planes: six limb leads (frontal) for axis and inferior/lateral walls, and six chest leads (horizontal) sweeping from septum to lateral wall.
- Read every tracing the same way — rate, rhythm, axis, intervals, then morphology by territory — so subtle findings are never crowded out by an obvious one.
- The core leads territories map is: inferior (II, III, aVF → RCA), septal (V1–V2 → LAD), anterior (V3–V4 → LAD), and lateral (I, aVL, V5–V6 → LCx).
- MI localization uses ST elevation in the facing leads to name the wall and predict the culprit artery; always suspect right-ventricular involvement in an inferior STEMI.
- Reciprocal changes (ST depression in the opposite leads) strongly support true occlusion and are sometimes the only sign of a posterior MI on a standard 12-lead.
- The frontal-plane axis, judged quickly from leads I and aVF, flags fascicular blocks, chamber strain, and old infarcts — and a change from a prior ECG is especially meaningful.
- A complete read also captures bundle branch blocks, AV blocks, hypertrophy, and metabolic clues, while staying alert to lead-reversal and placement artifacts.
- This content is educational, not medical advice; interpret ECGs within supervised training and current clinical protocols.
Practise 12-lead concepts
Test ECG and MI-localization questions with instant feedback.
Practise ECG →Frequently asked questions
What are the 12 leads on an ECG and what does each show?
The 12 leads come from 10 electrodes. Six limb leads (I, II, III, aVR, aVL, aVF) view the heart in the frontal plane and are used for axis: II, III, and aVF look at the inferior wall, while I and aVL look at the high lateral wall. Six chest leads (V1–V6) view the horizontal plane, sweeping from the septum (V1–V2) across the anterior wall (V3–V4) to the lateral wall (V5–V6).
How do you localize an MI on a 12-lead ECG?
Find which leads show ST-segment elevation and match them to a wall. Elevation in II, III, aVF means an inferior MI (usually the right coronary artery); V1–V4 means anterior/septal (the LAD); I, aVL, V5–V6 means lateral (the circumflex). Confirming reciprocal ST depression in the opposite leads increases your confidence that the elevation is a true infarct.
What are reciprocal changes on an ECG?
Reciprocal changes are ST-segment depressions seen in the leads that face the wall opposite an area of injury. They are the mirror image of the ST elevation caused by the infarct. Their presence strongly supports a true occlusive MI rather than a mimic like pericarditis, and in a posterior MI the reciprocal depression in V1–V3 may be the only clue on a standard 12-lead.
How do you determine cardiac axis quickly?
Use leads I and aVF. If the net QRS is positive in both, the axis is normal. Positive in I but negative in aVF is left axis deviation; negative in I but positive in aVF is right axis deviation; negative in both is an extreme (northwest) axis. For more precision, find the limb lead where the QRS is most equiphasic — the axis lies roughly perpendicular to it.
Which ECG leads correspond to which coronary artery?
Inferior leads (II, III, aVF) usually reflect the right coronary artery. Septal and anterior leads (V1–V4) reflect the left anterior descending artery. Lateral leads (I, aVL, V5–V6) reflect the left circumflex or a diagonal branch. Dominance varies between people, so an inferior infarct can occasionally come from the circumflex in left-dominant circulations.
What is a normal cardiac axis range?
A normal frontal-plane QRS axis in adults falls roughly between −30° and +90°, pointing down and to the patient's left. Values more negative than −30° are called left axis deviation, and values beyond +90° are right axis deviation. A shift beyond about +180° toward the upper right is an extreme or northwest axis, which should prompt a check for lead reversal.
Why can't a standard 12-lead ECG show a posterior MI directly?
None of the standard 12 leads face the back of the heart, so a posterior infarct produces no direct ST elevation on a routine tracing. Instead you infer it indirectly from reciprocal changes in V1–V3 — tall R waves with horizontal ST depression — and confirm it by placing posterior leads V7–V9, which do look directly at the posterior wall.
What is the difference between a rhythm strip and a 12-lead ECG?
A rhythm strip is usually a single lead recorded over time and is used to assess rate and rhythm. A 12-lead ECG records twelve simultaneous views and adds the ability to localize ischemia, determine axis, and detect chamber enlargement and conduction blocks. The 12-lead is also often better for rhythm analysis, because a P wave hidden in one lead may be clearly visible in another.
What are common mistakes when reading a 12-lead ECG?
The frequent traps are reversed limb electrodes (which can fake an abnormal axis or infarct), chest leads placed too high (which can mimic septal changes or a right bundle branch block), ignoring the calibration mark, and mistaking muscle-tremor artifact for an arrhythmia. When a finding does not match the patient, re-check lead placement before acting on it.
Sources & further reading
- Cardiovascular Credentialing International (CCI)
- American College of Cardiology
- American Heart Association
- MedlinePlus (U.S. National Library of Medicine)
External links are provided for reference; always confirm current details with the official source.