The Basics of ECG Interpretation
An ECG can look like a wall of squiggles until someone hands you a system — then it becomes a story the heart tells about itself, twelve short chapters at a time. This beginner-friendly guide breaks down the grid, the leads, and the P-QRS-T waves so you can read a rhythm strip with confidence. It is educational and not a substitute for individualized medical advice.
- What an ECG Actually Records
- Reading the Grid: Time and Voltage
- The 12 Leads: Twelve Views of One Heart
- The P-QRS-T Waves and What Each Means
- Normal Intervals and Durations
- A Systematic Approach: Rate, Rhythm, Axis, Intervals
- Rate and Rhythm: The First Big Questions
- Common Beginner Mistakes (and How to Dodge Them)
- Key Takeaways
What an ECG Actually Records
The electrocardiogram (ECG, or EKG from the older German spelling) is a voltage recorder. Every heartbeat begins as a wave of electrical charge that sweeps across the heart muscle, and skin electrodes pick up tiny shifts in that voltage as the wave approaches or moves away. The machine amplifies those signals and prints them against time, and the familiar peaks and valleys are simply that voltage rising and falling.
Here is the single most useful mental model for a beginner: when the electrical wave travels toward a positive electrode, the tracing goes up; when it moves away, the tracing goes down. That one rule explains why the same heartbeat looks tall and upright in one lead and inverted in another. Nothing is contradicting itself — you are just watching the same event from different camera angles.
It helps to remember what the ECG is not. It records electrical activity, not mechanical pumping. A patient can have a perfectly organized-looking rhythm on the monitor while the heart barely moves blood — a life-threatening scenario called pulseless electrical activity. So the ECG tells you about the heart's wiring, while pressure tracings and echo tell you about its plumbing and squeeze. If you want to see how the electrical story connects to pressures and flow, our overview of cardiovascular hemodynamics ties the two worlds together.
Reading the Grid: Time and Voltage
Before any wave means anything, you have to speak the language of the paper. The ECG grid is standardized worldwide so that a strip recorded in one hospital reads the same in another. Standard paper speed is 25 mm per second, and standard calibration is 10 mm per millivolt. Lock those two numbers in and the whole grid falls into place.
| Grid element | Horizontal (time) | Vertical (voltage) |
|---|---|---|
| Small box (1 mm) | 0.04 seconds (40 ms) | 0.1 mV |
| Large box (5 mm) | 0.20 seconds (200 ms) | 0.5 mV |
| Five large boxes | 1.0 second | 2.5 mV |
The horizontal axis is time and the vertical axis is amplitude. A wave that is wide has taken a long time to travel; a wave that is tall represents a larger voltage, which usually means more muscle mass or a more synchronized wavefront. This is why a thickened, high-pressure ventricle can throw unusually tall complexes, and why a widened QRS immediately signals that the ventricles are being activated slowly or abnormally.
The 12 Leads: Twelve Views of One Heart
A standard ECG has twelve leads, but only ten electrodes — the machine does the math to build extra views from combinations of the same electrodes. Beginners often assume twelve leads means twelve wires; it does not. Think of the leads as twelve cameras positioned around and across the heart, each looking at the electrical wavefront from its own vantage point.
The twelve leads split into two families. The six limb leads (I, II, III, aVR, aVL, aVF) look at the heart in the vertical, frontal plane — think top-to-bottom and side-to-side. The six chest (precordial) leads (V1 through V6) wrap across the front of the chest and view the heart in the horizontal plane, front-to-back. Together they surround the heart so that almost any region of injury or abnormal rhythm shows up somewhere.
Certain leads cluster by the wall of the heart they overlook, which is the key to localizing a heart attack. Leads II, III, and aVF look at the inferior wall; V1 and V2 look at the septum; V3 and V4 at the anterior wall; and I, aVL, V5, and V6 at the lateral wall. When you learn to read ST-elevation MI patterns, this grouping is what lets you say not just "there is a STEMI" but "the inferior wall is involved." Lead II is the workhorse for rhythm because it usually shows the clearest, most upright P wave.
The P-QRS-T Waves and What Each Means
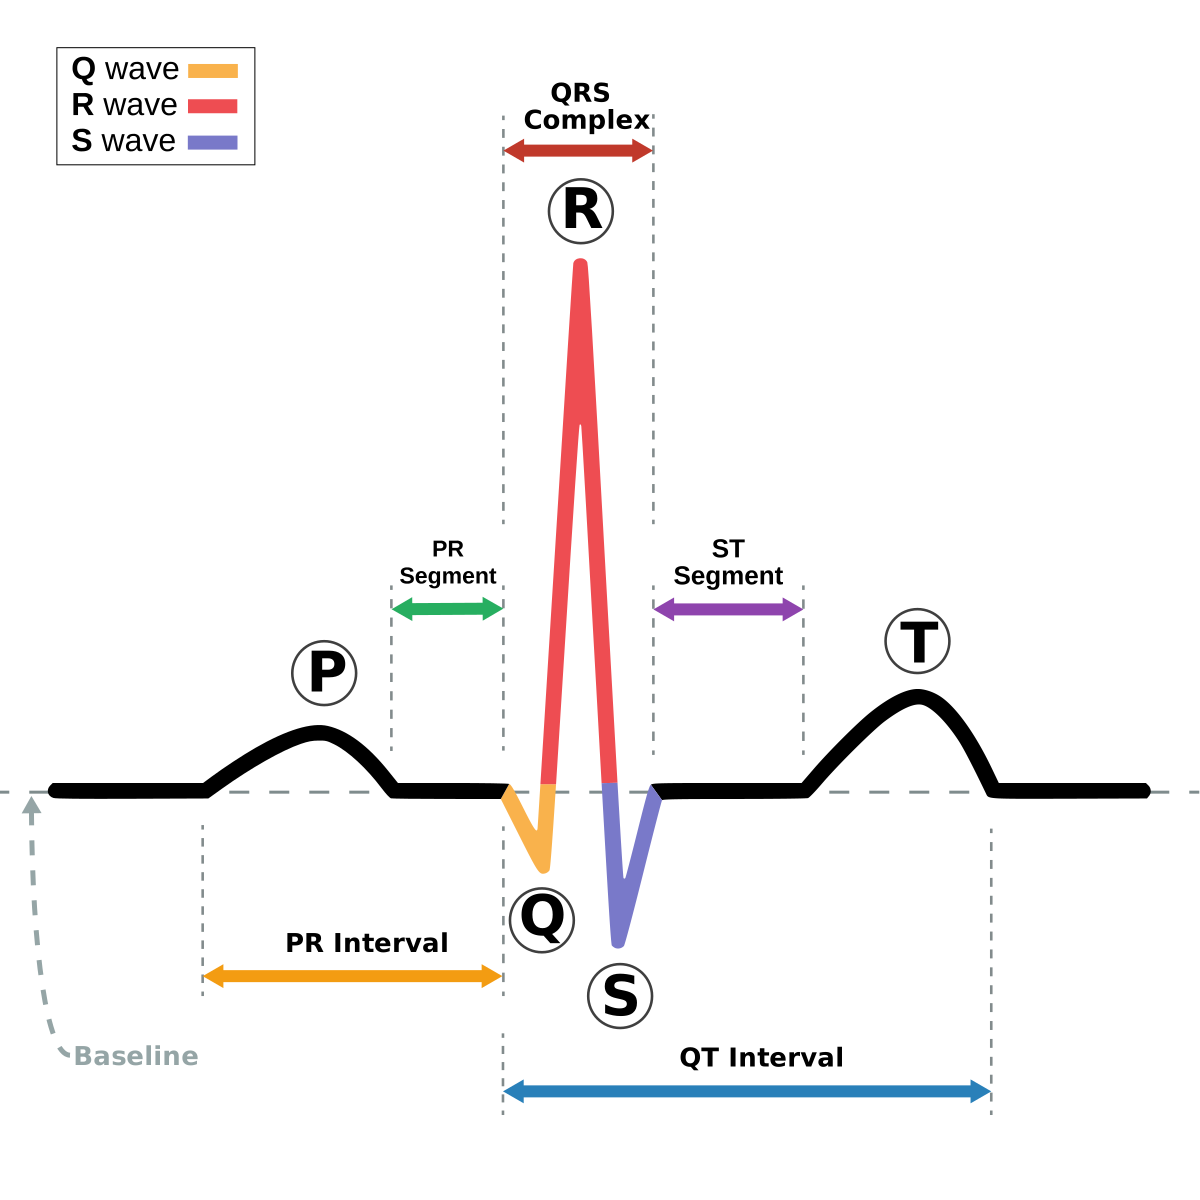
Every normal heartbeat writes the same three-part signature: a P wave, a QRS complex, and a T wave. Learn what each one represents and you can reason your way through most strips instead of memorizing pictures.
- P wave — atrial depolarization. The SA node fires, the atria contract, and you get a small, gently rounded bump. A normal upright P in lead II means the beat started where it should.
- QRS complex — ventricular depolarization. This is the big, sharp spike, and it is large because the ventricles carry most of the heart's muscle. A narrow QRS (under 0.12 s) tells you the ventricles were activated quickly through the normal conduction highway; a wide QRS says the signal took a slow detour.
- T wave — ventricular repolarization, the electrical reset before the next beat. It is usually a smooth, asymmetric hump in the same direction as the QRS.
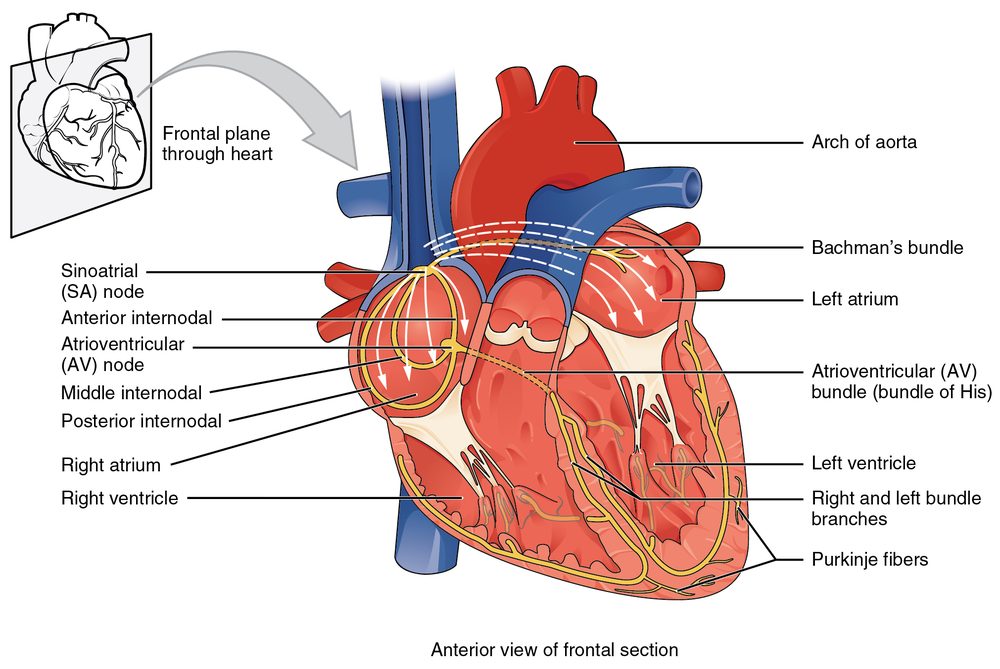
You will also hear about the PR interval (start of P to start of QRS, normally 0.12-0.20 s), which reflects the deliberate delay at the AV node that lets the atria finish filling the ventricles, and the QT interval, which covers the whole ventricular fire-and-reset cycle. Atrial repolarization does happen, but it is small and hidden inside the much larger QRS, which is why there is no visible "atrial T wave." To go deeper on the wiring behind these waves, the cardiac conduction system explainer walks through each structure the impulse passes.
Normal Intervals and Durations
Numbers give your eyeball impressions something to check against. These are the widely taught adult reference ranges; individual labs and guidelines vary slightly, and evidence on the exact cutoffs — especially for QTc — continues to evolve, so treat them as guardrails rather than absolute lines.
| Interval / wave | Normal adult range | What it reflects |
|---|---|---|
| P wave duration | < 0.12 s | Atrial depolarization |
| PR interval | 0.12-0.20 s | Atrial-to-ventricular conduction (AV delay) |
| QRS duration | < 0.12 s | Ventricular depolarization speed |
| QT interval (rate-corrected, QTc) | < ~0.44 s (men), < ~0.46 s (women) | Full ventricular fire-and-reset cycle |
A prolonged PR points toward AV conduction slowing, the hallmark of the various forms of AV block. A wide QRS raises the question of a bundle branch block or a beat originating in the ventricles themselves. And a long QTc is worth respecting because it flags vulnerability to a dangerous polymorphic rhythm called torsades de pointes; our dedicated piece on the QT interval and QTc correction covers the measurement pitfalls, and the QTc calculator does the rate correction for you.
A Systematic Approach: Rate, Rhythm, Axis, Intervals
The fastest way to fall behind on an ECG is to hunt for the dramatic finding first. Experienced readers do the opposite — they run the same checklist every single time, so nothing slips through. Adopt a fixed sequence early and it becomes automatic.
- Rate. At standard speed, count the large boxes between two R waves and divide into 300: one box apart is 300 bpm, two is 150, three is 100, four is 75, five is 60, six is 50. For irregular rhythms, count the QRS complexes in a 6-second strip and multiply by ten.
- Rhythm. Is it regular or irregular? Is there a P wave before every QRS, and a QRS after every P? Do the P waves all look alike?
- Axis. The overall direction the depolarization wave travels through the frontal plane. A quick beginner check: if the QRS is upright in leads I and II, the axis is normal.
- Intervals. Measure PR, QRS, and QT against the ranges above.
- Waves and segments. Finally, inspect P-wave shape, Q waves, ST-segment elevation or depression, and T-wave changes.
Only after that structured pass do you form an impression. This discipline is exactly what a good step-by-step ECG interpretation method is built to instill, and it is worth pairing with our deeper RCIS ECG study guide as you prepare.
Rate and Rhythm: The First Big Questions
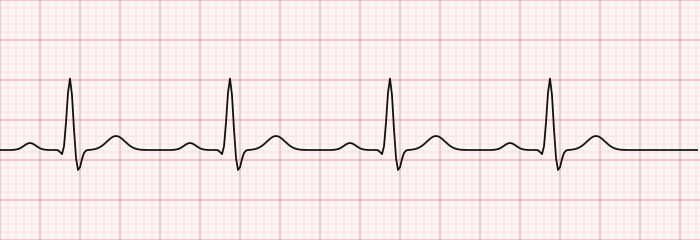
Two questions carry most of the diagnostic weight on a rhythm strip: how fast, and how regular. A normal resting adult heart runs about 60 to 100 beats per minute, driven by the SA node in an orderly sequence called normal sinus rhythm. In sinus rhythm every QRS is preceded by an upright P wave, the intervals are consistent, and the R-R spacing is even.
From that baseline, deviations sort into a few big buckets. A rate under 60 is bradycardia; over 100 is tachycardia. An irregularly irregular rhythm with no discernible P waves is the classic look of atrial fibrillation. A fast, wide-complex, regular run should make you think of ventricular tachycardia until proven otherwise, while a fast, narrow-complex rhythm points toward a supraventricular tachycardia. You do not need to name every rhythm on day one — you need to recognize when a pattern is normal and when it is not, then work systematically toward the label. Practicing on real tracings accelerates this more than anything; our ECG rhythm strip practice set is built for exactly that repetition.
Common Beginner Mistakes (and How to Dodge Them)
Almost every predictable error a new reader makes comes from skipping a basic check. Knowing the traps in advance is half the cure.
- Ignoring the calibration and speed. If the paper ran at a nonstandard speed or half calibration, your rates and amplitudes are meaningless. Check the marker first, every time.
- Chasing the exciting finding. Spotting ST elevation and stopping there means you may miss the heart block hiding two leads over. Run the full checklist.
- Confusing artifact with pathology. Muscle tremor, a loose lead, or shivering can mimic a wild arrhythmia. If a "rhythm" appears in one lead but the patient is talking comfortably, suspect artifact.
- Reading a single lead. One lead is one camera angle. A wave can be flat or inverted in one lead for entirely normal reasons; always corroborate across leads.
- Forgetting the patient. The ECG is a tool, not a verdict. A worrisome strip on a comfortable patient and a benign strip on a crashing patient both demand that you look up from the paper.
Building fluency is mostly about volume and structure — the more strips you read under the same disciplined method, the faster the pattern recognition becomes. A dedicated rhythm interpretation walkthrough and a bank of RCIS ECG practice questions will move you along faster than passive reading.
Key Takeaways
- The ECG records the heart's electrical activity, not its mechanical pumping — a normal-looking rhythm does not guarantee a pulse.
- Learn the grid first: at 25 mm/s and 10 mm/mV, a small box is 0.04 s and 0.1 mV; a large box is 0.20 s and 0.5 mV.
- Twelve leads, ten electrodes — each lead is a different camera angle, and leads group by the heart wall they overlook.
- Every normal beat writes a P (atria), QRS (ventricles firing), and T (ventricles resetting), with the PR and QT intervals bracketing key timing.
- Use a fixed sequence every time — rate, rhythm, axis, intervals, waves — so nothing gets missed.
- Normal sinus rhythm means an upright P before every QRS, even spacing, and a rate of 60-100 bpm.
- Verify calibration, read across leads, and never let the strip override the patient in front of you.
- This article is educational and does not replace training or individualized medical advice.
Frequently asked questions
What does P-QRS-T stand for on an ECG?
They are the named waves of one heartbeat. The P wave is atrial depolarization (the atria firing and contracting), the QRS complex is ventricular depolarization (the ventricles firing, the largest deflection), and the T wave is ventricular repolarization (the ventricles electrically resetting before the next beat). Together they represent one complete electrical cycle of the heart.
How do you read the grid on ECG paper?
At the standard paper speed of 25 mm per second and calibration of 10 mm per millivolt, each small 1 mm box equals 0.04 seconds horizontally and 0.1 mV vertically. Each large 5 mm box equals 0.20 seconds and 0.5 mV. Time runs left to right and voltage runs bottom to top, so wide waves took longer and tall waves carry more voltage.
Why are there 12 leads but only 10 electrodes?
The machine mathematically combines the signals from the ten physical electrodes to construct twelve different views. Six limb leads look at the heart in the frontal plane and six chest leads look at it in the horizontal plane, so twelve leads means twelve viewing angles, not twelve wires.
What is a normal PR interval and QRS duration?
In adults the PR interval is normally 0.12 to 0.20 seconds, reflecting the conduction delay at the AV node, and the QRS duration is normally less than 0.12 seconds, reflecting rapid ventricular activation. A long PR suggests AV block, and a wide QRS suggests a bundle branch block or a ventricular origin. These are widely taught ranges and may vary slightly by source.
How do you calculate heart rate from an ECG?
For a regular rhythm, count the number of large boxes between two R waves and divide into 300 (one box = 300 bpm, two = 150, three = 100, four = 75, five = 60, six = 50). For an irregular rhythm, count the QRS complexes in a 6-second strip and multiply by ten.
What is normal sinus rhythm?
Normal sinus rhythm is the heart's healthy default: the SA node drives each beat, there is an upright P wave before every QRS complex, the intervals are consistent, the R-R spacing is regular, and the rate sits between 60 and 100 beats per minute in a resting adult.
What is the difference between the P wave and the QRS complex?
The P wave represents the atria depolarizing and is a small, rounded bump. The QRS complex represents the ventricles depolarizing and is a tall, sharp spike because the ventricles hold far more muscle. In a normal beat, each P wave is followed by a QRS after the brief AV-node delay measured by the PR interval.
What is the best systematic way for a beginner to read an ECG?
Use the same checklist every time: check rate, then rhythm (regular or irregular, P before every QRS), then axis, then the PR, QRS, and QT intervals, and finally the individual waves and ST segments. Running this fixed sequence prevents you from fixating on one dramatic finding and missing another.
Does an ECG show if the heart is pumping blood?
No. The ECG records only electrical activity, not mechanical contraction. A heart can display an organized electrical rhythm on the monitor while producing little or no blood flow, a dangerous state called pulseless electrical activity. Assessing the actual pump requires a pulse check, blood pressure, echocardiography, or hemodynamic measurements.
Sources & further reading
- Cardiovascular Credentialing International (CCI)
- American College of Cardiology
- American Heart Association
- MedlinePlus (U.S. National Library of Medicine)
External links are provided for reference; always confirm current details with the official source.