Systemic Vascular Resistance (SVR): Formula, Normal Range & Meaning
Systemic vascular resistance (SVR) is the afterload the left ventricle pumps against — the single hemodynamic number that tells you whether a patient's circulation is clamped down tight or wide open. Master the formula, the normal range, and the high-versus-low patterns, and a wall of cath-lab numbers suddenly starts to make sense.
- What systemic vascular resistance actually measures
- The SVR formula and how to use it
- SVR normal range and the indexed version (SVRI)
- How SVR is measured in the cath lab and ICU
- High SVR: causes, patterns, and what it means
- Low SVR: the vasodilated, 'warm shock' picture
- SVR, afterload, and the whole hemodynamic picture
- Manipulating SVR: current therapeutic principles
- SVR on the RCIS exam and how to study it
- Key takeaways
What systemic vascular resistance actually measures
Systemic vascular resistance is the total resistance the arterial system offers to blood flow as it moves out of the left ventricle and through the systemic (body) circulation. Think of the circulation as plumbing: cardiac output is how much fluid the pump moves, blood pressure is the force in the pipes, and SVR is how narrow or wide those pipes are. When arterioles constrict, resistance climbs; when they dilate, it falls.
SVR is sometimes called total peripheral resistance (TPR), and in the cath lab and ICU it is treated as a stand-in for left-ventricular afterload — the load the heart must overcome to eject blood. It is not measured directly. Instead, it is calculated from pressures and flow, which is exactly why understanding the equation matters more than memorizing a single "normal" value.
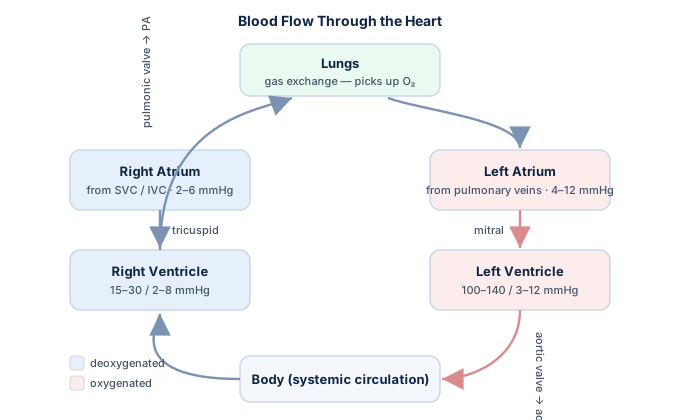
Because SVR ties directly into pressure and flow, it sits at the heart of nearly every hemodynamic calculation you will see. If you are building your foundations, our RCIS hemodynamics guide walks through how these numbers interlock, and the concept of resistance is inseparable from cardiac output — the flow term in the equation below.
The SVR formula and how to use it
The classic SVR formula is a rearrangement of Ohm's law applied to the circulation. Resistance equals the pressure drop across the systemic bed divided by the flow through it:
SVR = [(MAP − CVP) ÷ CO] × 80
- MAP — mean arterial pressure (mmHg), the average driving pressure into the systemic circulation.
- CVP — central venous pressure, also called right atrial pressure (mmHg), the downstream pressure blood drains back into.
- CO — cardiac output (L/min), the flow term, usually measured by thermodilution or the Fick method.
- 80 — a conversion factor that turns the raw Wood units (mmHg·min/L) into dynes·sec·cm⁻⁵, the units most clinicians report.
The pressure gradient is MAP minus CVP because resistance depends on the pressure drop across the bed, not the absolute arterial pressure alone. In most patients CVP is small (2–6 mmHg), so it nudges the result modestly — but in right-heart failure or volume overload, ignoring a high CVP will overestimate SVR.
Every input here has its own story worth knowing. Mean arterial pressure is not the simple average of systolic and diastolic — it is weighted toward diastole. And because CO drives the denominator, anything that changes stroke volume or heart rate ripples straight into your SVR value. You can skip the mental arithmetic entirely with our hemodynamic calculator, which computes SVR, PVR, and related indices from your measured pressures.
SVR normal range and the indexed version (SVRI)
The commonly cited normal range for systemic vascular resistance is 800 to 1,200 dynes·sec·cm⁻⁵. In Wood units (before multiplying by 80), that is roughly 10 to 15. Values above and below this band point toward the vasoconstricted and vasodilated states discussed later.
Because a big person and a small person move different absolute amounts of blood, some clinicians prefer the body-size–corrected version: systemic vascular resistance index (SVRI), which uses cardiac index (CO divided by body surface area) instead of raw cardiac output. This is the same logic behind reporting cardiac index rather than raw output.
| Parameter | Formula | Normal range |
|---|---|---|
| SVR | [(MAP − CVP) ÷ CO] × 80 | 800–1,200 dynes·sec·cm⁻⁵ |
| SVRI | [(MAP − CVP) ÷ CI] × 80 | 1,970–2,390 dynes·sec·cm⁻⁵/m² |
| SVR (Wood units) | (MAP − CVP) ÷ CO | 10–15 mmHg·min/L |
Reference ranges vary slightly between textbooks and lab conventions, so always defer to your own institution's reported normals. The numbers above are a widely taught teaching standard, not a diagnostic cutoff.
How SVR is measured in the cath lab and ICU
Since SVR is calculated, its accuracy is only as good as its inputs. In practice you need three simultaneous measurements: arterial pressure (for MAP), a right-atrial or central venous pressure, and a cardiac output. In the invasive setting these usually come from an arterial line and a pulmonary artery (Swan-Ganz) catheter.
The Swan-Ganz pulmonary artery catheter earns its keep here: it provides CVP from the proximal port, thermodilution cardiac output from the thermistor, and — with an arterial line — everything the SVR equation needs. Cardiac output can also be derived by the oxygen-consumption method; our Fick cardiac output tool shows how that flow term is generated when thermodilution is unreliable, such as in severe tricuspid regurgitation or low-output states.
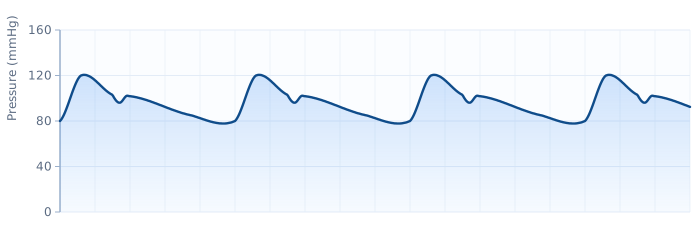
A few practical pitfalls: an under-damped or over-damped arterial line skews MAP and therefore SVR; a mistimed thermodilution injection throws off CO; and a mis-zeroed transducer corrupts every pressure. Garbage in, garbage out. Before you trust an abnormal SVR, confirm the waveforms look clean and the transducers are leveled to the phlebostatic axis.
High SVR: causes, patterns, and what it means
A high SVR (above roughly 1,200 dynes·sec·cm⁻⁵) means the arterial bed is constricted — the pipes are clamped down. The left ventricle now faces more afterload, and if the heart is weak, that added load can worsen forward output. High SVR is the body's classic compensatory response to a falling cardiac output: the arterioles squeeze to defend blood pressure.
Common causes include:
- Cardiogenic shock — a failing pump triggers intense reflex vasoconstriction. The hallmark is low output with high filling pressures and high SVR.
- Hypovolemic shock — blood loss or dehydration; the body constricts to preserve pressure with less volume.
- Chronic hypertension and vasopressor therapy — norepinephrine, phenylephrine, and high-dose dopamine all raise SVR by design.
- Hypothermia and excess catecholamines — both drive peripheral constriction.
The classic bedside sign of high SVR is a cold, clammy, mottled patient with poor capillary refill — a "cold shock" picture. Recognizing whether shock is warm or cold is central to the hemodynamic patterns covered in our guide to shock hemodynamics. When afterload is the problem in a failing heart, mechanical unloading with an intra-aortic balloon pump can reduce the resistance the ventricle ejects against.
Low SVR: the vasodilated, 'warm shock' picture
A low SVR (below roughly 800 dynes·sec·cm⁻⁵) means the arterioles are dilated and the circulation is running "wide open." Blood pressure can fall even when the heart is pumping normally or even briskly, because the tank has effectively gotten bigger. This is the signature of distributive shock.
- Septic shock — the prototypical low-SVR state. Inflammatory mediators dilate vessels body-wide, producing warm, flushed skin, bounding pulses, and a high cardiac output early on.
- Anaphylaxis — massive histamine-driven vasodilation.
- Neurogenic shock — loss of sympathetic tone after spinal cord injury.
- Liver failure and severe systemic inflammation — chronic vasodilated states.
- Vasodilator drugs — nitroprusside, high-dose nitroglycerin, milrinone, and anesthetics can all drop SVR.
The tell-tale contrast with cardiogenic shock is temperature and output: low-SVR patients are typically warm with a high or normal cardiac output, while high-SVR cardiogenic patients are cold with low output. Treatment flips accordingly — low SVR usually calls for fluids and vasopressors to restore tone, drugs you will meet again in our overview of cath lab medications.
SVR, afterload, and the whole hemodynamic picture
SVR never lives in isolation. It is one leg of a tightly linked triangle: blood pressure, cardiac output, and resistance. The relationship is best remembered as a rearranged Ohm's law — MAP is roughly the product of cardiac output and SVR (plus the venous pressure term). Change one variable and the others must adjust to keep pressure where the body wants it.
This is why you cannot read SVR alone. A normal blood pressure can hide a failing heart that is only staying afloat because SVR has cranked way up. Conversely, a septic patient can have a dangerously low pressure despite a soaring cardiac output, purely because SVR has collapsed. The number tells its story only in the company of output and pressure.
| Shock type | Cardiac output | SVR | Skin |
|---|---|---|---|
| Cardiogenic | Low | High | Cold, clammy |
| Hypovolemic | Low | High | Cold, pale |
| Septic (distributive) | High / normal | Low | Warm, flushed |
| Obstructive (e.g. tamponade) | Low | High | Cold |
That last row is worth a closer look — obstructive shock such as cardiac tamponade mimics cardiogenic shock hemodynamically, with high SVR compensating for an obstructed, under-filled ventricle. Afterload also shapes contractility measures; a heart with reduced ejection fraction is far more sensitive to SVR swings than a normal one, which is why afterload reduction is a cornerstone of heart-failure therapy.
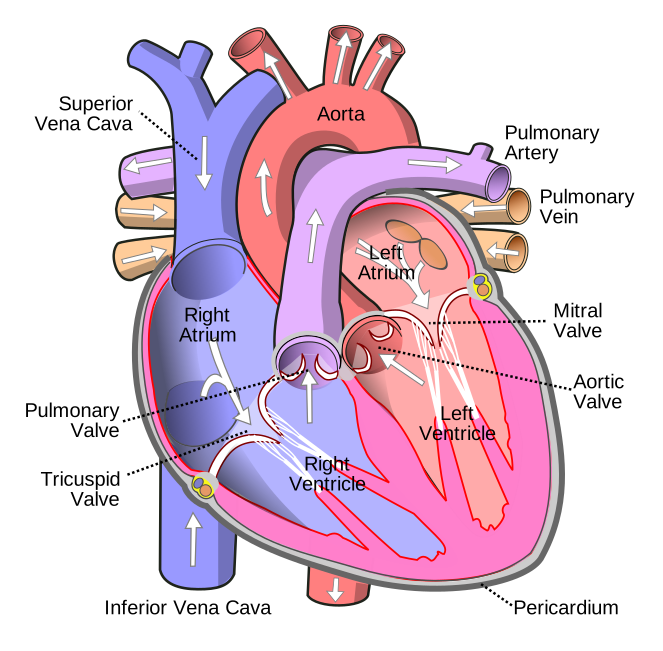
Manipulating SVR: current therapeutic principles
Because SVR is a lever on both blood pressure and cardiac work, clinicians actively manipulate it. The guiding principle in current critical-care and heart-failure guidance is to match the intervention to the underlying physiology rather than chasing a target number in isolation.
- Raising SVR — vasopressors such as norepinephrine are first-line in distributive (septic) shock to restore vascular tone. Vasopressin and phenylephrine are adjuncts. The goal is a perfusing mean arterial pressure, commonly a MAP target around 65 mmHg, individualized to the patient.
- Lowering SVR — afterload reduction with vasodilators, ACE inhibitors/ARBs, and inodilators like milrinone helps a failing left ventricle eject more effectively. In advanced heart failure this is a well-established strategy, detailed in our review of heart-failure medications.
The evidence here continues to evolve. Optimal MAP and SVR targets differ by patient, comorbidity, and shock subtype, and guidelines increasingly favor dynamic, perfusion-guided endpoints (lactate clearance, urine output, mental status) over any single resistance value. This article is educational and is not medical advice — real management decisions belong to the treating clinician at the bedside.
SVR on the RCIS exam and how to study it
Systemic vascular resistance is a high-yield topic for the Registered Cardiovascular Invasive Specialist exam and for anyone working toward a career as a cardiovascular technologist. Expect calculation questions (plug values into the formula), pattern-recognition questions (match a set of numbers to a shock type), and unit-conversion traps.
To lock it in, drill three things until they are automatic: the formula with its ×80 conversion, the 800–1,200 dynes·sec·cm⁻⁵ normal range, and the high-versus-low shock table above. Then practice applying them under time pressure. Our RCIS hemodynamics practice questions put SVR into exam-style scenarios, and because these concepts sit alongside waveform and rhythm interpretation, it helps to keep your ECG interpretation skills sharp in parallel.
A logical study path: start with the hemodynamics fundamentals guide, work the calculator until the arithmetic feels effortless, then test yourself on scenario questions until you can name the shock type from the numbers alone. That sequence — concept, computation, application — is how the highest-scoring candidates approach it.
Key takeaways
- SVR is afterload: it measures the resistance the left ventricle ejects against and stands in for systemic afterload.
- The formula: SVR = [(MAP − CVP) ÷ CO] × 80, giving dynes·sec·cm⁻⁵; drop the 80 for Wood units.
- Normal range: roughly 800–1,200 dynes·sec·cm⁻⁵ (SVRI ~1,970–2,390 when indexed to body surface area).
- High SVR means constricted vessels — think cold shock: cardiogenic, hypovolemic, or vasopressor-driven states.
- Low SVR means dilated vessels — think warm shock: sepsis, anaphylaxis, and neurogenic shock.
- Never read it alone: interpret SVR alongside cardiac output and blood pressure, and always in clinical context.
- Educational only: targets and thresholds are evolving; this is study material, not medical advice.
Calculate SVR & PVR
Enter mean pressures and cardiac output to get systemic and pulmonary vascular resistance.
Open the SVR Calculator →Frequently asked questions
What is the normal range for systemic vascular resistance?
The commonly taught normal range for SVR is 800 to 1,200 dynes·sec·cm⁻⁵ (about 10 to 15 Wood units before the ×80 conversion). The indexed version, SVRI, normally runs about 1,970 to 2,390 dynes·sec·cm⁻⁵/m². Reference values vary between institutions, so defer to your own lab's reported normals.
What is the formula for SVR?
SVR = [(MAP − CVP) ÷ CO] × 80, where MAP is mean arterial pressure, CVP is central venous (right atrial) pressure, and CO is cardiac output in liters per minute. The gradient (MAP − CVP) is the pressure drop across the systemic bed, and the 80 converts the result into dynes·sec·cm⁻⁵. Omit the 80 and the answer is in Wood units.
What does a high SVR indicate?
A high SVR (above ~1,200 dynes·sec·cm⁻⁵) indicates vasoconstriction — the arterial vessels are clamped down. It is typical of cardiogenic and hypovolemic shock (a compensatory squeeze to defend blood pressure) and of vasopressor therapy. Clinically it often shows up as a cold, clammy, poorly perfused patient.
What does a low SVR indicate?
A low SVR (below ~800 dynes·sec·cm⁻⁵) indicates vasodilation — the vessels are wide open. It is the hallmark of distributive shock: septic shock, anaphylaxis, and neurogenic shock. These patients are often warm and flushed with a normal or high cardiac output despite a low blood pressure.
Why is SVR multiplied by 80 in the formula?
The factor of 80 is a unit-conversion constant. Without it, the calculation yields Wood units (mmHg·min/L). Multiplying by 80 converts the value into the CGS unit dynes·sec·cm⁻⁵, which is how most clinicians and monitors report SVR.
What is the difference between SVR and SVRI?
SVR uses raw cardiac output, while SVRI (systemic vascular resistance index) uses cardiac index — cardiac output divided by body surface area. SVRI corrects for body size so values are comparable between a large and a small patient, much like using cardiac index instead of raw cardiac output.
Is SVR the same as afterload?
SVR is the most commonly used clinical estimate of left-ventricular afterload, but they are not identical. True afterload also depends on ventricular wall stress, chamber geometry, and aortic impedance. In everyday practice, though, SVR is treated as a practical stand-in for systemic afterload.
How is SVR measured in the cath lab?
SVR is not measured directly — it is calculated from three inputs: mean arterial pressure (from an arterial line), central venous or right atrial pressure, and cardiac output. A pulmonary artery (Swan-Ganz) catheter conveniently supplies the CVP and thermodilution cardiac output, and an arterial line supplies MAP.
What is a normal SVR in Wood units?
In Wood units (the value before multiplying by 80), a normal SVR is roughly 10 to 15 mmHg·min/L. Multiplying that range by 80 gives the more familiar 800 to 1,200 dynes·sec·cm⁻⁵.
Sources & further reading
- Cardiovascular Credentialing International (CCI)
- American College of Cardiology
- American Heart Association
- MedlinePlus (U.S. National Library of Medicine)
External links are provided for reference; always confirm current details with the official source.