Cardiac Output: Normal Values, Formula & Measurement
Cardiac output is the single most important number in the circulation — the volume of blood your heart delivers to the body every minute. This guide walks through the normal range, the formula, what raises and lowers it, and exactly how it is measured at the bedside and in the cath lab.
What is cardiac output?
Cardiac output is the volume of blood the heart pumps into the systemic circulation each minute. It is the bottom line of cardiovascular performance: no matter how healthy the coronary arteries or how clean the electrocardiogram looks, if output falls, tissues starve for oxygen. Everything the heart does — filling, contracting, and ejecting — ultimately serves this one job of matching blood flow to the body's moment-to-moment demand.
At rest, a typical adult heart moves roughly 5 liters of blood per minute, which is close to the body's entire blood volume recirculated every 60 seconds. During heavy exercise, a fit person can push that figure to 20–25 L/min. That enormous reserve is what lets you sprint for a bus without fainting, and losing it is what makes heart failure so disabling.
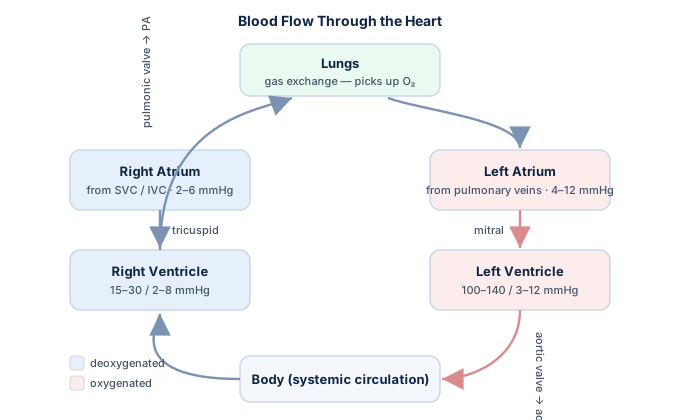
Because output depends on the whole pump working in sequence, understanding it means understanding rate, rhythm, filling, and squeeze together. If you are studying for a credential exam, it helps to pair this article with our broader hemodynamics study guide, which places cardiac output in the context of pressures and resistances.
The cardiac output formula
The formula is refreshingly simple and worth committing to memory:
Cardiac output (CO) = heart rate (HR) × stroke volume (SV)
Heart rate is beats per minute; stroke volume is the milliliters of blood ejected with each beat. Multiply them and the milliliters-per-minute figure converts to liters per minute. A worked example makes it concrete: a heart beating 70 times a minute and ejecting 70 mL per beat produces 70 × 70 = 4,900 mL/min, or about 4.9 L/min.
Two derived numbers build directly on this equation. Divide output by body surface area and you get cardiac index, which normalizes flow to patient size. Rearrange it and you can estimate stroke volume from a known output and rate. You can run either calculation quickly with our Fick cardiac output calculator.
Normal cardiac output values
The commonly quoted resting adult range is 4 to 8 L/min, though the exact numbers vary a little between textbooks and depend on body size, age, and fitness. Because raw output does not account for a person's size, clinicians lean on cardiac index for severity grading — a 4.5 L/min output is comfortable for a small adult but marginal for a large one.
| Measure | Typical resting range | Note |
|---|---|---|
| Cardiac output | 4–8 L/min | Heart rate × stroke volume |
| Cardiac index | 2.5–4.0 L/min/m² | Output ÷ body surface area |
| Stroke volume | 60–100 mL | Per beat |
| Heart rate | 60–100 bpm | Resting sinus rhythm |
| Ejection fraction | 52–72% (men), 54–74% (women) | Fraction of end-diastolic volume ejected |
These are educational reference ranges, not treatment thresholds; a real patient is always read in context. Note that cardiac index below roughly 2.2 L/min/m² is the classic marker for cardiogenic shock. Ejection fraction is a related but separate percentage — see our ejection fraction guide for why a normal EF does not guarantee a normal output.
What determines cardiac output?
Since output equals rate times stroke volume, only two levers move it — but stroke volume itself is governed by three classic determinants. Understanding these four factors together explains almost every clinical change in output.
Heart rate
Sympathetic tone, circulating catecholamines, and the intrinsic pacemaker set the rate. Faster generally means more output, until diastole gets so short that filling suffers. Very slow rates (heart block, sinus bradycardia) drop output directly; very fast, poorly filled rhythms do the same from the other end.
Preload
Preload is the degree the ventricle is stretched by incoming blood at end-diastole. By the Frank–Starling mechanism, a more filled ventricle contracts more forcefully and ejects more — up to a point. This is why fluids raise output in a hypovolemic patient and why venous return matters so much.
Afterload
Afterload is the resistance the ventricle must overcome to eject, dominated by systemic vascular resistance and arterial pressure. Raise afterload and stroke volume tends to fall; vasodilators can improve output in a failing heart by unloading it.
Contractility
Contractility is the intrinsic vigor of the squeeze, independent of load. Sympathetic stimulation and inotropes such as dobutamine raise it; ischemia, acidosis, and many cardiomyopathies lower it.
How cardiac output is measured
There is no single “cardiac output meter.” Instead, several methods estimate flow from different physical principles, each with its own strengths and blind spots. The two invasive standards — Fick and thermodilution — dominate the cardiac cath lab, while echocardiography and newer minimally invasive monitors cover the noninvasive space.
| Method | How it works | Best used when |
|---|---|---|
| Fick principle | Oxygen uptake ÷ arteriovenous oxygen difference | Low-output states, shunts, tricuspid regurgitation |
| Thermodilution | Cold-saline temperature curve via a pulmonary-artery catheter | Routine ICU and cath-lab monitoring |
| Echocardiography | LVOT diameter × velocity-time integral × heart rate | Noninvasive bedside or clinic assessment |
| Pulse-contour / bioreactance | Arterial waveform analysis or thoracic bioreactance | Continuous, minimally invasive trending |
The next two sections unpack the two invasive gold standards, since they show up most often on credentialing exams and in the invasive lab. If you work in that setting, our overview of what a cardiac cath lab does gives useful background.
Fick principle vs. thermodilution
Both invasive methods usually require a Swan-Ganz (pulmonary-artery) catheter, but they measure flow in completely different ways.
The Fick principle
The Fick method rests on a conservation law: the oxygen the lungs take up equals the oxygen carried away by the blood. Rearranged, cardiac output = oxygen consumption ÷ (arterial − venous oxygen content). In practice, the team measures or estimates oxygen consumption and samples arterial and mixed-venous blood. Because it does not depend on a clean, brisk flow curve, Fick stays accurate in low-output states, significant tricuspid regurgitation, and intracardiac shunts — exactly where thermodilution struggles. Its main weakness is that oxygen consumption is often assumed rather than directly measured, which introduces error.
Thermodilution
Thermodilution injects a known volume of cold saline through the catheter's proximal port; a thermistor downstream in the pulmonary artery records how the blood temperature dips and recovers. The area under that temperature-versus-time curve is inversely proportional to flow — a bigger, longer dip means slower output. It is fast, repeatable, and needs no blood sampling, which is why it is the ICU workhorse. But it becomes unreliable in low output, severe tricuspid regurgitation, and shunts, since the cold bolus gets diluted or recirculated abnormally.
You can practice these distinctions in our targeted hemodynamics practice questions.
Echocardiography and noninvasive methods
Not every patient needs a catheter. Echocardiography estimates stroke volume by measuring the diameter of the left ventricular outflow tract (LVOT) and the velocity-time integral of blood flowing through it, then multiplying by heart rate to get output. It is noninvasive, widely available, and repeatable — though it is operator-dependent and sensitive to how accurately the LVOT is measured.
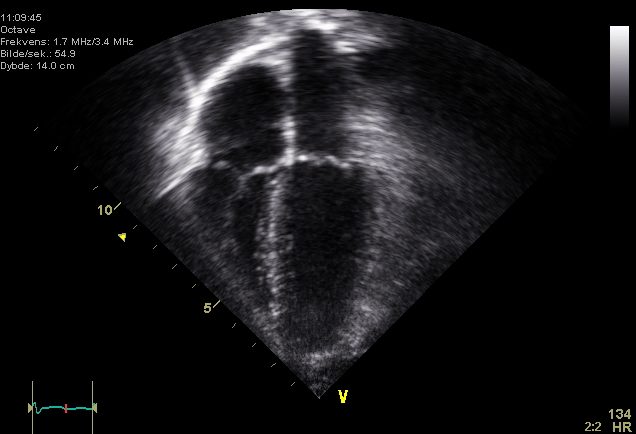
A growing family of minimally invasive and fully noninvasive monitors — arterial pulse-contour analysis, bioreactance, and esophageal Doppler — provide continuous output trends without a pulmonary-artery catheter. Current critical-care guidance generally favors these less invasive tools for routine monitoring, reserving the Swan-Ganz catheter for complex or refractory cases; the evidence on which monitor is best in which patient is still evolving, so clinicians weigh accuracy against invasiveness case by case. If sonography interests you, see the role of the cardiovascular ultrasound technologist.
High and low cardiac output states
Abnormal output splits into two broad, clinically opposite pictures. Low output means the pump cannot keep up; high output means demand or shunting outstrips a normal pump.
| Low cardiac output | High cardiac output | |
|---|---|---|
| Common causes | Heart failure, cardiogenic shock, hypovolemia, severe brady- or tachyarrhythmia, large myocardial infarction | Sepsis, severe anemia, hyperthyroidism, pregnancy, large arteriovenous fistulae, beriberi |
| The problem | The pump itself is failing or underfilled | The pump is fine; demand or low resistance is the driver |
| Typical signs | Cool extremities, fatigue, low urine output, hypotension | Warm, flushed skin; bounding pulses; wide pulse pressure |
Low output that progresses to organ hypoperfusion becomes shock. In cardiogenic shock, mechanical support such as an intra-aortic balloon pump may be used to prop up output while the underlying cause is treated. A large myocardial infarction or a poorly tolerated arrhythmia like ventricular tachycardia can drop output abruptly, which is why rhythm and output are always assessed together.
This is general educational information about physiology, not medical advice; any specific patient's output is interpreted by their clinical team alongside pressures, labs, and imaging.
Why cardiac output matters clinically
Cardiac output is not an abstract number — it is the variable that many other measurements exist to protect. Mean arterial pressure, for instance, is the product of output and systemic vascular resistance, so blood pressure can look normal even as output falls if the body clamps down its vessels to compensate. That is exactly why a “normal” blood pressure can mask a failing circulation.
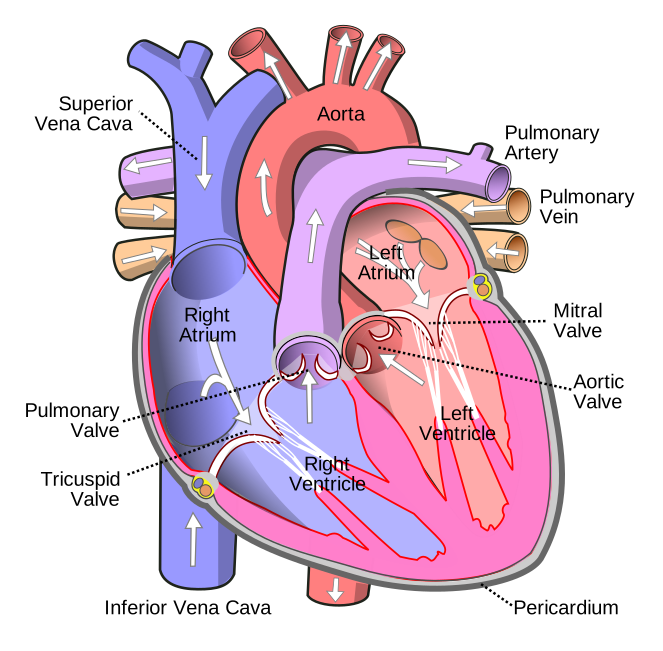
In the cath lab and ICU, output guides real decisions: whether to give fluids or diuretics, whether to start an inotrope, whether a patient in shock needs mechanical support, and whether a valve lesion is severe enough to fix. It also feeds derived calculations — vascular resistance and valve area (via the Gorlin equation) both require a cardiac output value as an input, which is why an inaccurate output propagates errors downstream. Understanding the underlying pump anatomy helps; our cardiac anatomy guide reviews the chambers and valves involved.
Key takeaways
- Cardiac output = heart rate × stroke volume, and the normal resting range is about 4–8 L/min.
- Stroke volume is set by three determinants — preload, afterload, and contractility — with heart rate as the fourth overall lever.
- Indexing output to body surface area gives cardiac index, a fairer severity marker; below ~2.2 L/min/m² signals cardiogenic shock.
- It is measured by the Fick principle, thermodilution, echocardiography, or newer minimally invasive monitors — each with distinct strengths.
- Fick is preferred in low output, shunts, and tricuspid regurgitation, where thermodilution reads unreliably.
- Low output points to pump failure or underfilling; high output points to sepsis, anemia, thyrotoxicosis, or shunting.
- This article is educational and not a substitute for professional medical evaluation.
Calculate cardiac output
Use the Fick method to compute cardiac output and cardiac index.
Open the Fick Calculator →Frequently asked questions
What is a normal cardiac output?
About 4 to 8 L/min at rest for an average adult. Indexed to body size, the cardiac index normalizes this to roughly 2.5–4.0 L/min/m², which is the fairer way to compare people of different builds.
What is the cardiac output formula?
Cardiac output equals heart rate multiplied by stroke volume (CO = HR × SV). For example, 70 beats per minute × 70 mL per beat gives about 4.9 L/min.
How is cardiac output measured?
By the Fick principle (oxygen consumption divided by the arteriovenous oxygen difference), thermodilution through a pulmonary-artery catheter, echocardiography using the LVOT diameter and velocity-time integral, or newer pulse-contour and bioreactance monitors.
What determines cardiac output?
Heart rate and stroke volume. Stroke volume in turn depends on preload (ventricular filling), afterload (the resistance to ejection), and contractility (the strength of the squeeze).
What is the difference between cardiac output and cardiac index?
Cardiac index is cardiac output divided by body surface area, so it accounts for patient size. A single output value can be adequate for a small adult but low for a large one; the index removes that ambiguity.
Why is the Fick method preferred over thermodilution in some patients?
Thermodilution becomes unreliable in low-output states, severe tricuspid regurgitation, and intracardiac shunts because the cold bolus is diluted or recirculated abnormally. The Fick principle does not depend on a clean flow curve, so it stays accurate in those settings.
What causes low cardiac output?
Heart failure, cardiogenic shock, hypovolemia, a large myocardial infarction, and significant brady- or tachyarrhythmias. In each case the pump either fails or is underfilled, and tissues become underperfused.
What causes high cardiac output?
High-demand or low-resistance states such as sepsis, severe anemia, hyperthyroidism, pregnancy, and large arteriovenous shunts. Here the pump works normally, but demand or shunting drives flow abnormally high.
Can blood pressure be normal when cardiac output is low?
Yes. Mean arterial pressure equals cardiac output times systemic vascular resistance, so the body can raise resistance to keep pressure looking normal even as output falls. This is why blood pressure alone can mask a failing circulation.
Sources & further reading
- Cardiovascular Credentialing International (CCI)
- American College of Cardiology
- American Heart Association
- MedlinePlus (U.S. National Library of Medicine)
External links are provided for reference; always confirm current details with the official source.