Swan-Ganz Catheter (Pulmonary Artery Catheter): A Complete Guide
The Swan-Ganz catheter — better known today as the pulmonary artery catheter — is the classic bedside tool for reading the right heart from the inside, and the waveform sequence it produces as it floats from the right atrium to the wedge position is a favorite of the RCIS exam. This guide walks through insertion, the chamber-by-chamber waveforms, PCWP, thermodilution cardiac output, and how clinicians use each number.
- What is a Swan-Ganz catheter?
- Why and when it is used
- The pathway through the heart
- Insertion waveforms step by step
- Normal pressures at a glance
- Understanding PCWP (pulmonary capillary wedge pressure)
- Thermodilution and cardiac output
- Reading the numbers: hemodynamic profiles
- Complications and safe technique
- Swan-Ganz on the RCIS exam
- Key takeaways
What is a Swan-Ganz catheter?
A Swan-Ganz catheter is a long, flexible, balloon-tipped catheter that is floated through the right heart into the pulmonary artery to measure pressures, cardiac output, and mixed venous oxygen saturation. It is the reason the terms "Swan-Ganz catheter" and "pulmonary artery catheter" are used interchangeably — the device carries the name of Jeremy Swan and William Ganz, who introduced the flow-directed, balloon-tipped design in the early 1970s.
The genius of the original design was the balloon. Earlier attempts to catheterize the pulmonary artery required fluoroscopy and a good deal of pushing. Swan reportedly got the idea watching sailboats carried by the wind, and the balloon does exactly that: inflated at the tip, it lets the bloodstream itself drag the catheter forward through the right atrium, right ventricle, and out into the pulmonary artery. That is why the catheter is described as flow-directed.
A standard pulmonary artery catheter has several lumens. A distal port at the very tip reads pulmonary artery pressure and, when the balloon is wedged, the pulmonary capillary wedge pressure. A proximal port sitting in the right atrium reads right atrial pressure and delivers the injectate for thermodilution. A thermistor near the tip measures blood temperature, and a separate channel inflates the balloon. Some catheters add fiberoptics for continuous oxygen saturation or a pacing lumen. If you want the broader framework these numbers live in, our hemodynamics study guide ties the whole right-heart study together.
This article is educational and not medical advice. Indications, thresholds, and techniques vary by institution and by patient; always follow current guidelines and local protocols.
Why and when it is used
The pulmonary artery catheter answers questions that a blood pressure cuff and a stethoscope cannot: What is the filling pressure of the left heart? Is this patient's low output a pump problem, a volume problem, or a resistance problem? How much blood is the heart actually moving per minute? Those are the questions that separate cardiogenic shock from septic shock at the bedside.
Classic indications include the diagnosis and management of shock of unclear cause, severe or refractory heart failure, evaluation of pulmonary hypertension, assessment before and after cardiac surgery, and the workup of valvular and congenital lesions in the cath lab. It is also used to guide therapy — titrating fluids, vasopressors, inotropes, and vasodilators against real numbers rather than guesswork.
It is worth being honest about the evidence, because the RCIS exam increasingly expects it. Large trials such as ESCAPE in heart failure and several critical-care studies did not show that routine pulmonary artery catheter use improves survival, and in some settings it added complications. The result is a clear modern shift: the catheter is used far more selectively than it was in the 1980s and 1990s, reserved for situations where the hemodynamic picture is genuinely unclear or where the numbers will change management — for instance, distinguishing and managing the different forms of shock, or evaluating a patient for advanced heart failure therapies. Think of it as a precision instrument, not a routine monitor.
| Common indication | What the catheter helps answer |
|---|---|
| Undifferentiated shock | Is it cardiogenic, hypovolemic, distributive, or obstructive? |
| Severe heart failure | Filling pressures, cardiac output, response to therapy |
| Pulmonary hypertension | PA pressures and pulmonary vascular resistance |
| Cardiac surgery | Perioperative hemodynamic optimization |
| Cardiac tamponade / constriction | Equalization of diastolic pressures |
The pathway through the heart
To read the waveforms, you first have to picture the road the catheter travels. It enters a central vein — most often the right internal jugular or the subclavian — and is advanced toward the right atrium. From there the flow-directed balloon carries it across the tricuspid valve into the right ventricle, up through the pulmonary valve into the main pulmonary artery, and finally into a branch pulmonary artery where it wedges.
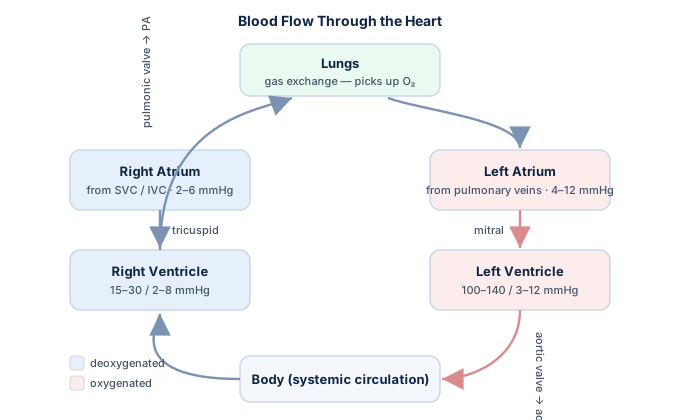
The right internal jugular is often preferred because it offers the straightest, most forgiving line into the right atrium. Each transition — vein to atrium, atrium to ventricle, ventricle to artery — announces itself with a change in the pressure tracing, which is exactly what makes the insertion a self-guiding procedure. You are not flying blind; the waveform tells you where the tip is at every step. Reviewing normal cardiac chambers and valves in our cardiac anatomy guide makes the sequence far easier to remember, because each waveform is really just the mechanical signature of the chamber the tip is sitting in.
The distances are fairly predictable. From a right internal jugular or subclavian approach, the right atrium is usually reached around 15–20 cm, the right ventricle around 30 cm, the pulmonary artery around 40–45 cm, and the wedge position around 45–55 cm. If the catheter has been advanced well past the expected wedge depth without a wedge tracing, it may be coiling — a cue to stop and reassess rather than keep pushing.
Insertion waveforms step by step
This is the heart of the topic and the part the exam loves most. As the balloon-tipped catheter floats forward, the waveform on the monitor transforms at each chamber. Learn to recognize the four signatures — right atrium, right ventricle, pulmonary artery, and wedge — and you can narrate the entire insertion from the tracing alone.
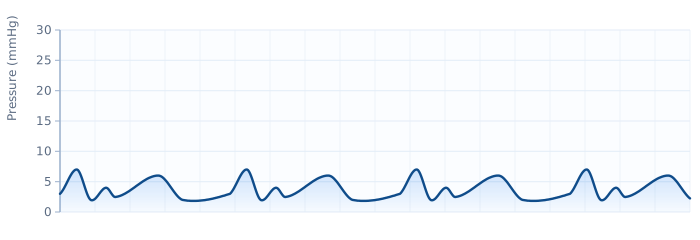
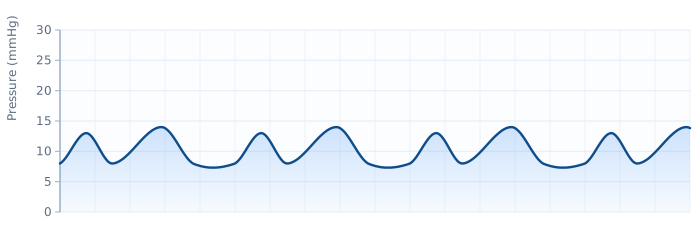
1. Right atrium (RA). The first tracing is a low, gently undulating waveform with characteristic a, c, and v waves and a mean pressure of roughly 2–6 mmHg. The a wave reflects atrial contraction, the c wave the tricuspid valve bulging back during early ventricular contraction, and the v wave atrial filling against a closed valve. It is a quiet, low-amplitude signal.
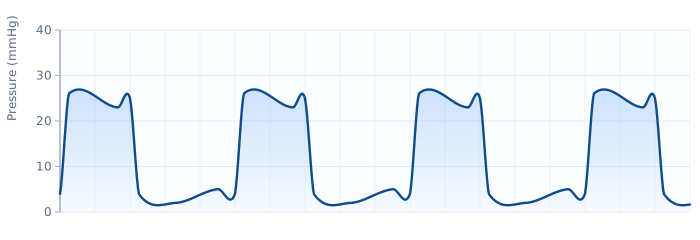
2. Right ventricle (RV). Crossing the tricuspid valve, the tracing suddenly grows tall. Systolic pressure jumps to around 15–30 mmHg while diastolic pressure stays low, near 0–8 mmHg. The hallmark is a wide pulse pressure with a low diastolic that rises during filling — the tip is now inside a pumping chamber, and premature beats are common here as the catheter irritates the ventricle.
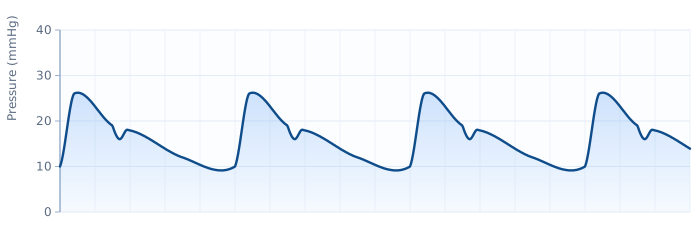
3. Pulmonary artery (PA). As the tip crosses the pulmonary valve, systolic pressure stays roughly the same as the RV (about 15–30 mmHg), but the diastolic pressure jumps up to around 8–15 mmHg, and a dicrotic notch appears from pulmonary valve closure. That step-up in diastolic pressure is the single most reliable clue that you have entered the pulmonary artery.
4. Pulmonary capillary wedge (PCWP). Advancing a little further with the balloon inflated, the catheter wedges in a branch artery and the pulsatile PA tracing collapses into a low, atrial-looking waveform with a and v waves and a mean of roughly 6–12 mmHg. This is the wedge — a downstream window on left atrial pressure, covered in detail below.
Normal pressures at a glance
Committing the normal ranges to memory pays off on the exam and at the bedside, because abnormal numbers only mean something against a known baseline. Values vary slightly between references, but the following are the widely taught norms.
| Site | Pressure (mmHg) | Waveform clue |
|---|---|---|
| Right atrium (RA / CVP) | Mean 2–6 | Low; a, c, v waves |
| Right ventricle (RV) | 15–30 / 0–8 | Tall systole, low rising diastole |
| Pulmonary artery (PA) | 15–30 / 8–15 (mean 10–20) | Diastolic step-up, dicrotic notch |
| Pulmonary capillary wedge (PCWP) | Mean 6–12 | Atrial-type a and v waves |
| Cardiac output | 4–8 L/min | Measured by thermodilution |
| Cardiac index | 2.5–4.0 L/min/m² | Output ÷ body surface area |
A few relationships are worth internalizing. PA systolic pressure normally equals RV systolic pressure, because in the absence of pulmonary stenosis nothing sits between them during systole. PA diastolic pressure normally sits just slightly above the wedge pressure, so a PA diastolic that greatly exceeds the wedge suggests pulmonary vascular disease. And the wedge, PA diastolic, and left atrial pressures all cluster together in a healthy patient — when they diverge, the divergence itself is the diagnosis. For the derived numbers you build from these pressures, see our pages on cardiac output and cardiac index.
Understanding PCWP (pulmonary capillary wedge pressure)
Pulmonary capillary wedge pressure is an indirect estimate of left atrial pressure, and therefore of left ventricular filling (preload), obtained by inflating the balloon until the catheter wedges in a small pulmonary artery. When the balloon occludes forward flow, the distal port looks through the static column of blood downstream, past the pulmonary capillaries, and "sees" the pressure in the pulmonary veins and left atrium.
That chain — wedge estimates left atrial pressure, which estimates left ventricular end-diastolic pressure — is why the wedge is so clinically powerful. It lets a right-sided catheter report on the left heart without ever crossing into it. A high wedge (say, above 18 mmHg) points toward left-heart failure or volume overload and is the hemodynamic fingerprint of cardiogenic pulmonary edema. A low wedge in a hypotensive patient points instead toward hypovolemia or a distributive/vasodilatory picture.
The wedge tracing also carries diagnostic detail in its a and v waves. A giant v wave, for example, classically appears in acute mitral regurgitation, as the regurgitant volume slams back into the left atrium during systole. Reading those subtleties correctly requires clean technique: measure at end-expiration, confirm a true wedge tracing rather than an over-wedged or damped signal, and never leave the balloon inflated longer than necessary, because a persistently wedged, inflated balloon risks pulmonary infarction or, rarely, arterial rupture. The wedge is also central to distinguishing the various shock states and to recognizing the equalization of pressures seen in cardiac tamponade.
Thermodilution and cardiac output
Thermodilution is the method the Swan-Ganz catheter uses to measure cardiac output: a known volume of cool fluid is injected into the right atrium, and a thermistor near the catheter tip records how the blood temperature changes as that cooled blood flows past. It is an elegant application of the indicator-dilution principle, using temperature as the indicator instead of a dye.
The mechanics are straightforward. A measured bolus — commonly 10 mL of room-temperature or iced saline — is injected through the proximal (RA) port. As the cooled blood is carried through the right ventricle and past the thermistor in the pulmonary artery, the thermistor plots a temperature-versus-time curve. The monitor integrates the area under that curve, and the relationship is inverse: a high cardiac output whisks the cool blood past quickly, producing a small, brief dip (small area under the curve), while a low output lets the temperature change linger, producing a large area. Several injections are averaged to smooth out beat-to-beat variation.
| Thermodilution curve | Area under curve | Cardiac output |
|---|---|---|
| Small, narrow, brief dip | Small | High output |
| Large, wide, prolonged dip | Large | Low output |
Thermodilution has well-known pitfalls that make excellent exam questions. Significant tricuspid regurgitation causes the cold indicator to slosh back and forth, falsely lowering the measured output. Intracardiac shunts distort the curve. Errors in injectate volume or temperature, or injecting too slowly, throw the number off. In those settings, clinicians often fall back on the Fick method, which calculates output from oxygen consumption and the arteriovenous oxygen difference; you can explore that calculation with our Fick cardiac output tool. From the raw output, you can derive stroke volume, indexed values, and — using the wedge and RA pressures — systemic vascular resistance. Our hemodynamic calculator ties these derived numbers together in one place.
Reading the numbers: hemodynamic profiles
The real payoff of the pulmonary artery catheter is pattern recognition. Once you have the RA pressure, wedge, cardiac output/index, and derived resistance, the different shock states sort themselves into recognizable profiles. This is where the isolated numbers become a diagnosis.
| State | RA / CVP | PCWP | Cardiac output | SVR |
|---|---|---|---|---|
| Hypovolemic shock | Low | Low | Low | High |
| Cardiogenic shock | High | High | Low | High |
| Septic / distributive (warm) | Low | Low/normal | High | Low |
| Obstructive (e.g., tamponade) | High | High (equalized) | Low | High |
Read across the rows and the logic is clean. Hypovolemia empties the tank — low filling pressures everywhere, output down, and the body clamps vessels to compensate (high resistance). Cardiogenic shock is a failing pump behind a full tank — high filling pressures, low output. Warm septic shock is the odd one out: the vessels have gone slack, so resistance is low and the heart is actually pumping more than normal to compensate. Tamponade and other obstructive states squeeze the heart from outside, driving the diastolic pressures up and equalizing them.
These profiles are exactly why the catheter earns its place in genuinely undifferentiated shock: two patients can look identically hypotensive at the bedside yet need opposite treatments — fluids for one, diuresis and inotropes for another. The numbers break the tie. They also guide therapy over time, and in cardiogenic shock they often accompany decisions about mechanical support such as an intra-aortic balloon pump. To lock in this pattern recognition, work through the hemodynamics practice questions.
Complications and safe technique
The pulmonary artery catheter is invasive, and its risks are a major reason for the modern trend toward selective use. Knowing them is both good practice and reliable exam material.
- Arrhythmias during insertion. As the catheter crosses the right ventricle it commonly triggers premature ventricular contractions, and occasionally runs of ventricular tachycardia or transient right bundle branch block. Watching the ECG throughout is essential; understanding the rhythms it can provoke is easier after reviewing our ECG rhythm interpretation guide.
- Pulmonary artery rupture or infarction. Over-inflating the balloon or leaving it wedged too long can damage or infarct a branch pulmonary artery — rare but potentially fatal. The rule is to inflate only to obtain a wedge, keep it brief, and deflate immediately afterward.
- Balloon-related issues. Never inflate against resistance, never use more than the recommended volume, and never inject fluid to inflate the balloon.
- Access and catheter complications. Central venous access carries risks of pneumothorax, arterial puncture, bleeding, and — with any indwelling line — infection and thrombosis. Knotting or migration of the catheter can also occur.
Safe practice comes down to disciplined habits: advance only with the balloon inflated, withdraw only with it deflated, watch the waveform and ECG continuously, confirm a proper wedge rather than an over-wedged tracing, and minimize wedge time. Much of this technique is shared with the broader environment of the cardiac cath lab, where many of these studies are performed.
Swan-Ganz on the RCIS exam
For RCIS candidates and cardiovascular technologists, the pulmonary artery catheter is nearly guaranteed material because it braids together anatomy, waveforms, pressures, and calculations. Expect to identify a chamber from a pressure tracing, to state normal ranges, to explain what the wedge estimates, and to reason through a thermodilution curve or a shock profile.
A handful of high-yield facts carry most of the questions. The wedge estimates left atrial pressure and therefore left ventricular preload. The RV-to-PA transition is marked by a rise in diastolic pressure at unchanged systole. Thermodilution output is inversely related to the area under the temperature curve. Tricuspid regurgitation falsely lowers thermodilution output. And routine use has not been shown to improve survival, which is why the catheter is now used selectively. Pair this article with the broader hemodynamics guide and the cardiac output and systemic vascular resistance pages, then test yourself.
Key takeaways
- The Swan-Ganz (pulmonary artery) catheter is a balloon-tipped, flow-directed catheter floated through the right heart to measure pressures, cardiac output, and mixed venous oxygen saturation.
- Insertion produces a fixed waveform sequence: RA to RV to PA to wedge; the RV-to-PA step is recognized by a rising diastolic pressure with unchanged systole and a dicrotic notch.
- Normal pressures: RA 2–6, RV 15–30/0–8, PA 15–30/8–15, PCWP 6–12 mmHg.
- PCWP estimates left atrial pressure and therefore left ventricular preload — a right-sided measurement that reports on the left heart.
- Thermodilution measures cardiac output from a temperature-dilution curve; output is inversely proportional to the area under the curve, and tricuspid regurgitation falsely lowers it.
- Combining RA, wedge, output, and resistance yields hemodynamic profiles that distinguish hypovolemic, cardiogenic, distributive, and obstructive shock.
- Because routine use has not improved survival and it carries real risks, the catheter is now used selectively. This content is educational, not medical advice — always follow current guidelines and local protocols.
Practise the insertion waveforms
Identify RA, RV, PA, and wedge tracings with instant feedback.
Practise Waveforms →Frequently asked questions
What is a Swan-Ganz catheter used for?
A Swan-Ganz, or pulmonary artery, catheter is used to measure pressures inside the right heart and pulmonary artery, estimate left-heart filling pressure through the wedge, and measure cardiac output by thermodilution. Clinically it helps diagnose and manage undifferentiated shock, severe heart failure, and pulmonary hypertension, and it guides fluid, vasopressor, and inotrope therapy when the hemodynamic picture is unclear.
What is the correct order of waveforms during insertion?
As the balloon-tipped catheter floats forward, the waveforms appear in a fixed order: right atrium (RA), then right ventricle (RV), then pulmonary artery (PA), then pulmonary capillary wedge (PCWP). Each transition changes the tracing — the RA is low with a, c, and v waves; the RV shows tall systole with low diastole; the PA shows a diastolic step-up and a dicrotic notch; and the wedge collapses into a low, atrial-type waveform.
What does PCWP measure?
Pulmonary capillary wedge pressure is an indirect estimate of left atrial pressure, and therefore of left ventricular end-diastolic pressure, or preload. When the balloon is wedged, forward flow stops and the distal port reads the downstream pressure of the pulmonary veins and left atrium. A high wedge suggests left-heart failure or volume overload, while a low wedge suggests hypovolemia.
What are the normal pressures on a Swan-Ganz catheter?
Widely taught norms are: right atrium mean 2–6 mmHg; right ventricle 15–30 over 0–8 mmHg; pulmonary artery 15–30 over 8–15 mmHg; and pulmonary capillary wedge mean 6–12 mmHg. Cardiac output is typically 4–8 L/min and cardiac index 2.5–4.0 L/min/m². Ranges vary slightly between references.
How does thermodilution measure cardiac output?
A known volume of cool saline is injected into the right atrium, and a thermistor near the catheter tip records the resulting temperature change in the pulmonary artery over time. The monitor calculates output from the area under that temperature-time curve, and the relationship is inverse: a high cardiac output produces a small, brief curve, while a low output produces a large, prolonged one.
How do you tell the right ventricle from the pulmonary artery on the waveform?
Both have similar systolic pressure, so the key is the diastolic pressure. In the right ventricle, diastole is low (about 0–8 mmHg) and rises during filling. When the catheter crosses into the pulmonary artery, the diastolic pressure steps up (to about 8–15 mmHg) and a dicrotic notch appears from pulmonary valve closure, while systole stays about the same.
Why is the pulmonary artery catheter used less often now?
Large trials, including ESCAPE in heart failure and several critical-care studies, did not show that routine use improves survival, and it carries real risks such as arrhythmias, infection, and pulmonary artery injury. As a result it is now used selectively — reserved for situations where the hemodynamic diagnosis is genuinely unclear or the numbers will change management, rather than as a routine monitor.
What can make thermodilution cardiac output inaccurate?
Significant tricuspid regurgitation causes the cold indicator to recirculate and falsely lowers the measured output. Intracardiac shunts distort the curve, and errors in injectate volume, temperature, or injection speed introduce further error. In these settings clinicians often rely on the Fick method instead, which calculates output from oxygen consumption and the arteriovenous oxygen difference.
Is a Swan-Ganz catheter dangerous?
It is an invasive procedure with real but usually manageable risks, including arrhythmias during insertion, infection, thrombosis, and rare pulmonary artery rupture or infarction from over-inflating or over-wedging the balloon. Safe technique — advancing with the balloon inflated, deflating promptly, and minimizing wedge time — reduces these risks. This information is educational and not a substitute for professional medical judgment.
Sources & further reading
- Cardiovascular Credentialing International (CCI)
- American College of Cardiology
- American Heart Association
- MedlinePlus (U.S. National Library of Medicine)
External links are provided for reference; always confirm current details with the official source.