Mean Arterial Pressure (MAP): Formula, Normal Range & Meaning
Mean arterial pressure (MAP) is the single number that best answers the question every clinician cares about at the bedside: is this patient's blood actually reaching their organs? It is not the top number on the cuff and it is not a simple average — it is the true driving pressure of perfusion, and understanding it turns a blur of vital signs into a clear picture of who is stable and who is slipping.
- What mean arterial pressure actually measures
- The MAP formula and how to calculate it
- What is a normal MAP?
- Why MAP 65 is the number everyone quotes
- MAP vs blood pressure: what is the difference?
- How MAP is measured in the cath lab and ICU
- MAP, organ perfusion, and the whole hemodynamic picture
- Raising and lowering MAP: current principles
- MAP on the RCIS exam and how to study it
- Key takeaways
What mean arterial pressure actually measures
Mean arterial pressure is the average pressure in a person's arteries throughout one full cardiac cycle. That word average is doing a lot of quiet work. A blood pressure reading like 120/80 gives you two snapshots — the peak during systole and the trough during diastole — but blood is being pushed into your organs during the entire cycle, not just at those two instants. MAP captures that whole-cycle driving force in a single figure.
Here is the key insight that makes MAP click: your heart spends roughly two-thirds of each cycle in diastole (relaxation) and only about one-third in systole (contraction). Because the arteries sit at the lower diastolic pressure for most of the cycle, the true average is not the midpoint between systolic and diastolic — it lands closer to the diastolic value. That is why MAP is weighted toward diastole, and why a person with a blood pressure of 120/80 has a MAP near 93, not 100.
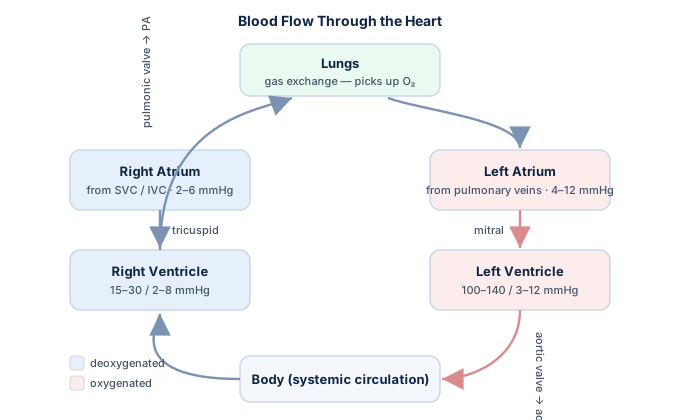
Clinically, MAP matters because organ perfusion depends on it. Your brain, kidneys, and heart are perfused by the sustained pressure across the whole cycle, not by the fleeting systolic peak. When MAP drops too low, those organs start to starve regardless of what the systolic number says. Because MAP sits at the center of nearly every pressure-and-flow relationship in the circulation, it anchors much of what you will study in our RCIS hemodynamics guide.
The MAP formula and how to calculate it
The most widely taught MAP formula reflects that diastole-heavy timing directly. It weights diastolic pressure twice as much as systolic:
MAP = (SBP + 2 × DBP) ÷ 3
- SBP — systolic blood pressure (mmHg), the peak pressure during ventricular contraction.
- DBP — diastolic blood pressure (mmHg), the resting pressure between beats.
- The 2× on diastole and the ÷3 reflect that the cardiac cycle is roughly one-third systole and two-thirds diastole at a normal heart rate.
Work a quick example. For a blood pressure of 120/80: MAP = (120 + 2 × 80) ÷ 3 = (120 + 160) ÷ 3 = 280 ÷ 3 ≈ 93 mmHg. Notice how the answer sits well below the 100 you would get by naively averaging 120 and 80 — that is the diastolic weighting at work.
An equivalent and often handier version uses pulse pressure (the difference between systolic and diastolic):
MAP = DBP + (⅓ × pulse pressure)
For the same 120/80, pulse pressure is 40, so MAP = 80 + (40 ÷ 3) = 80 + 13.3 ≈ 93 mmHg. Both formulas give the same answer; use whichever is faster for you.
These estimation formulas assume a normal heart rate. At very fast rates, diastole shortens and the true MAP creeps higher than the formula predicts; at very slow rates the opposite happens. That is why the numbers your invasive monitor displays — computed from the actual area under the arterial waveform — are more accurate than any hand calculation.
What is a normal MAP?
A normal mean arterial pressure for a healthy adult falls roughly between 70 and 100 mmHg. Most clinicians treat a MAP of at least 60 to 65 mmHg as the minimum needed to adequately perfuse the vital organs — the brain, heart, and kidneys — under ordinary conditions.
Below that floor, autoregulation (the body's ability to keep organ blood flow steady across a range of pressures) begins to fail, and perfusion falls in step with pressure. Sustained MAP under about 60 mmHg is associated with organ hypoperfusion and, if prolonged, injury. On the other end, a chronically elevated MAP reflects the same forces that drive hypertension and its long-term cardiovascular risk.
| MAP (mmHg) | General interpretation |
|---|---|
| 70–100 | Normal range for a healthy adult |
| 60–65 | Common minimum target for organ perfusion |
| Below 60 | Risk of organ hypoperfusion; often treated urgently |
| Above 100–110 | Elevated; consistent with hypertension |
These bands are widely taught teaching standards, not rigid diagnostic cutoffs. The right target for any individual depends on their baseline, comorbidities, and clinical situation — a lifelong hypertensive brain may autoregulate at a higher pressure than a young trauma patient. Always defer to your institution's protocols and the treating team. This article is educational and is not medical advice.
Why MAP 65 is the number everyone quotes
If you spend any time in an ICU or a cath lab, you will hear the phrase "keep the MAP above 65" constantly. That threshold comes largely from sepsis and shock research: major critical-care guidance, including the Surviving Sepsis Campaign, recommends an initial target of MAP ≥ 65 mmHg when resuscitating adults with septic shock. It is the point at which, for most patients, organ perfusion is reasonably preserved.
But 65 is a starting point, not a universal law. The evidence here is genuinely evolving. Large trials comparing higher MAP targets (around 80–85 mmHg) against the standard 65 have generally found no across-the-board mortality benefit to pushing pressure higher — and higher targets can bring more arrhythmias from the extra vasopressor needed. That said, subgroups such as chronically hypertensive patients may benefit from a slightly higher floor, which is why guidelines increasingly favor individualized, perfusion-guided targets over a single magic number.
When pressure will not hold despite fluids, clinicians reach for vasopressors and, in cardiogenic cases, mechanical support. The physiology of how those interventions restore MAP is spelled out in our overview of shock hemodynamics, and afterload-manipulating devices like the intra-aortic balloon pump come into play when a failing heart cannot generate an adequate MAP on its own.
MAP vs blood pressure: what is the difference?
People often use "blood pressure" and "MAP" loosely, but they answer different questions. A standard blood pressure reading (say 118/76) reports two discrete pressures — the systolic peak and the diastolic trough. MAP distills the entire cardiac cycle into one number representing the average perfusion pressure. Think of blood pressure as the highest and lowest points on a mountain range, and MAP as the range's overall elevation.
So which should you watch? For diagnosing and tracking hypertension in the clinic, systolic and diastolic readings remain the standard, and systolic pressure in particular is the strongest predictor of cardiovascular risk in older adults. But in the critically ill — shock, sepsis, post-cardiac-surgery, the cath lab — MAP is often the number the team titrates to, because it maps most directly onto whether organs are being perfused.
| Feature | Systolic / Diastolic BP | Mean arterial pressure |
|---|---|---|
| What it reports | Two snapshots (peak & trough) | One whole-cycle average |
| Best for | Diagnosing & tracking hypertension | Guiding resuscitation & perfusion |
| Reflects perfusion? | Indirectly | Directly |
| Where it shines | Clinic, screening | ICU, cath lab, OR |
There is also a deeper relationship worth knowing. MAP is not a free-floating value — it is the product of flow and resistance. Specifically, MAP ≈ (cardiac output × systemic vascular resistance) + central venous pressure. That equation is a rearranged form of Ohm's law applied to the circulation, and it explains why a change in either cardiac output or systemic vascular resistance will move MAP. It is the same relationship, viewed from the other side, that lets clinicians back-calculate resistance from a measured MAP.
How MAP is measured in the cath lab and ICU
There are two ways to get a MAP, and they differ in accuracy. A noninvasive blood pressure cuff (automated oscillometric monitor) actually measures MAP most reliably at the point of maximal oscillation, then estimates systolic and diastolic from it — the reverse of what most people assume. For quick, intermittent readings on a stable patient, the cuff is fine.
For unstable patients or beat-to-beat precision, an arterial line is the gold standard. A catheter placed in the radial or femoral artery transmits the pressure waveform to a transducer, and the monitor computes MAP as the true area under the arterial pressure curve divided by the cycle time — no estimation formula required. This is why the arterial-line MAP can differ from the cuff, especially at extremes of pressure or in arrhythmias like atrial fibrillation where beat-to-beat pressure varies.
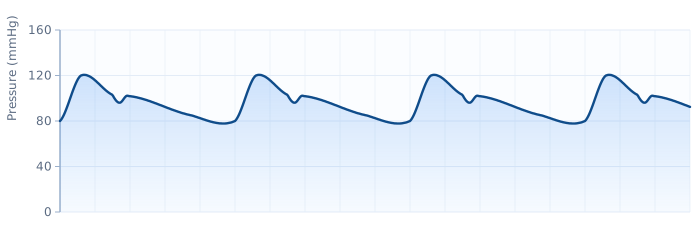
Accurate invasive MAP depends on a clean setup. The transducer must be zeroed to atmosphere and leveled to the phlebostatic axis (roughly the mid-axillary line at the fourth intercostal space). An over-damped line (from an air bubble, clot, or kinked tubing) blunts the waveform and can falsely lower the reading; an under-damped or "whippy" line overshoots the systolic peak. MAP is actually the most damping-resistant part of the tracing, which is another reason clinicians trust it during transducer trouble. The pressure tracings you will interpret alongside MAP are covered in our hemodynamics fundamentals guide, and the invasive tool that supplies many of these numbers is the Swan-Ganz pulmonary artery catheter.
MAP, organ perfusion, and the whole hemodynamic picture
MAP earns its clinical importance because it is the numerator of nearly every perfusion pressure in the body. Coronary, cerebral, and renal perfusion pressures are all essentially MAP minus the downstream pressure of the organ in question. Drop MAP, and every one of those gradients narrows at once.
Coronary perfusion is a special case worth understanding. The left ventricle perfuses its own muscle mainly during diastole, when the heart relaxes and the coronary vessels are no longer being squeezed. Because diastolic pressure drives coronary flow and MAP is weighted toward diastole, MAP is a good proxy for how well the heart muscle itself is being fed — a critical concept in the coronary circulation and in ischemic disease.
MAP also cannot be read in isolation. Remember the governing relationship: MAP is the product of cardiac output and systemic vascular resistance. A normal MAP can mask a failing heart whose output is propped up only because resistance has clamped down; a septic patient can crater their MAP despite a soaring output because resistance has collapsed. To interpret a MAP correctly, you need to know what is happening to flow and resistance behind it.
| Scenario | Cardiac output | SVR | Typical MAP |
|---|---|---|---|
| Healthy adult | Normal | Normal | 70–100 |
| Septic (distributive) shock | High / normal | Low | Low |
| Cardiogenic shock | Low | High | Low |
| Hypovolemic shock | Low | High | Low |
That interplay is why MAP shows up as an input to so many derived values, from systemic vascular resistance to cardiac work indices. Anything that changes stroke volume or heart rate ripples straight into MAP, and a heart with a reduced ejection fraction has far less reserve to defend its pressure when resistance shifts.
Raising and lowering MAP: current principles
Because MAP is the lever on organ perfusion, clinicians actively drive it up or down. The guiding principle in current critical-care and heart-failure guidance is to match the intervention to the underlying physiology — to fix why the MAP is off, not just to chase the number.
- Raising a low MAP — start with the cause. Hypovolemia calls for fluids; distributive (septic) shock calls for vasopressors such as norepinephrine to restore vascular tone once volume is addressed; a failing pump may need inotropes or mechanical support. The common initial target is a MAP around 65 mmHg, individualized upward for chronic hypertensives.
- Lowering a dangerously high MAP — in hypertensive emergencies, careful titrated reduction with agents like intravenous nitroglycerin, nicardipine, or nitroprusside protects organs from the pressure — but abrupt over-correction can itself cause hypoperfusion, so the pace matters.
The drugs used to nudge MAP in the invasive setting are surveyed in our review of cath lab medications, and the longer-term agents that manage chronic pressure and afterload appear in our overview of heart-failure medications. You can also skip the arithmetic and compute MAP and related indices from measured pressures with our hemodynamic calculator.
MAP on the RCIS exam and how to study it
Mean arterial pressure is a high-yield topic for the Registered Cardiovascular Invasive Specialist exam and for anyone training as a cardiovascular technologist. Expect three flavors of question: straight calculation (plug systolic and diastolic into the formula), interpretation (is this MAP adequate for perfusion?), and integration (how does MAP relate to cardiac output and resistance?).
Drill these until they are automatic: the (SBP + 2×DBP) ÷ 3 formula, the 70–100 mmHg normal range, the ≥ 65 mmHg perfusion floor, and the diastolic-weighting logic behind why MAP sits closer to the bottom number. Then practice under time pressure — our RCIS hemodynamics practice questions put MAP into exam-style scenarios, and because pressure interpretation lives right next to rhythm reading, it pays to keep your ECG interpretation skills sharp in parallel.
A logical study path: begin with the hemodynamics fundamentals guide, then use the calculator until the arithmetic feels effortless, then test yourself on scenario questions until you can judge whether a given MAP is adequate at a glance. Concept, computation, application — in that order — is how the strongest candidates lock it in.
Key takeaways
- MAP is the perfusion pressure: the average arterial pressure across the whole cardiac cycle, and the best single indicator of whether organs are being fed.
- The formula: MAP = (SBP + 2 × DBP) ÷ 3, or equivalently DBP + (⅓ × pulse pressure). Diastole gets double weight, so MAP sits nearer the diastolic number.
- Normal range: roughly 70–100 mmHg, with about 60–65 mmHg as the common minimum for adequate organ perfusion.
- MAP 65 is the widely quoted resuscitation floor from sepsis guidance — a starting point to individualize, not a universal goal.
- MAP vs blood pressure: cuff readings track hypertension; MAP guides resuscitation because it maps directly onto perfusion.
- Never read it alone: MAP is cardiac output times systemic vascular resistance (plus venous pressure) — interpret it alongside flow and resistance.
- Educational only: targets are evolving and patient-specific; this is study material, not medical advice.
Calculate MAP
Enter systolic and diastolic pressure to get the mean arterial pressure.
Open the MAP Calculator →Frequently asked questions
How do you calculate mean arterial pressure?
The standard estimate is MAP = (SBP + 2 × DBP) ÷ 3, where SBP is systolic and DBP is diastolic pressure. For a blood pressure of 120/80, MAP = (120 + 160) ÷ 3 ≈ 93 mmHg. An equivalent formula is MAP = DBP + (⅓ × pulse pressure). Diastole is weighted twice because the heart spends about two-thirds of each cycle in diastole.
What is a normal mean arterial pressure?
A normal MAP for a healthy adult is roughly 70 to 100 mmHg. Most clinicians treat a MAP of at least 60 to 65 mmHg as the minimum needed to adequately perfuse the brain, heart, and kidneys. These are teaching standards; individual targets depend on the patient's baseline and clinical situation.
Why is a MAP of 65 important?
MAP 65 mmHg is the widely cited minimum target for resuscitating patients in shock, drawn largely from sepsis guidance such as the Surviving Sepsis Campaign. It is the pressure at which most patients maintain reasonable organ perfusion. It is a floor to build on, not a universal goal — chronically hypertensive patients may need a higher target, and perfusion signs like lactate and urine output matter more than the number alone.
What is the difference between MAP and blood pressure?
A blood pressure reading gives two snapshots — the systolic peak and diastolic trough (e.g., 120/80). MAP condenses the entire cardiac cycle into one average perfusion pressure. Blood pressure is standard for diagnosing hypertension; MAP is preferred in critical care because it reflects organ perfusion more directly.
Why is diastolic pressure weighted more heavily in the MAP formula?
Because the heart spends roughly two-thirds of each cardiac cycle in diastole and only about one-third in systole. Since the arteries sit at the lower diastolic pressure for most of the cycle, the true average is pulled toward the diastolic value — hence the 2× weighting on DBP in the (SBP + 2×DBP) ÷ 3 formula.
Is MAP more important than systolic blood pressure?
It depends on the setting. For diagnosing and tracking hypertension, systolic pressure is the stronger predictor of long-term cardiovascular risk. In critically ill patients — shock, sepsis, the cath lab — MAP is often the number teams titrate to, because it maps most directly onto whether organs are being perfused.
What happens if MAP is too low?
When MAP falls below about 60 mmHg, the body's autoregulation begins to fail and organ blood flow drops in step with pressure. Sustained low MAP causes hypoperfusion of the brain, heart, and kidneys and, if prolonged, organ injury. This is why low MAP in shock is treated urgently with fluids, vasopressors, or mechanical support depending on the cause.
How is MAP measured with an arterial line?
An arterial catheter transmits the pressure waveform to a transducer, and the monitor computes MAP as the area under the arterial pressure curve divided by the cycle time — the true average, not an estimate. This is the gold standard for unstable patients. Accuracy depends on zeroing the transducer to atmosphere and leveling it to the phlebostatic axis.
Does MAP relate to cardiac output and vascular resistance?
Yes. MAP is essentially cardiac output multiplied by systemic vascular resistance, plus central venous pressure — a rearranged Ohm's law for the circulation. This means a low MAP can come from low output (as in cardiogenic or hypovolemic shock) or from low resistance (as in septic shock), which is why MAP must be interpreted alongside flow and resistance.
Sources & further reading
- Cardiovascular Credentialing International (CCI)
- American College of Cardiology
- American Heart Association
- MedlinePlus (U.S. National Library of Medicine)
External links are provided for reference; always confirm current details with the official source.