Cardiac Output vs Cardiac Index
Cardiac output tells you how much blood the heart pumps each minute; cardiac index takes that same number and scales it to the patient's body size. They sound interchangeable, but confusing them is one of the fastest ways to misread a hemodynamic study — so this guide lays out the difference, the formulas, the normal values, and why the index so often wins at the bedside.
- Cardiac output vs cardiac index: the quick answer
- What is cardiac output?
- What is cardiac index?
- The formulas side by side
- Normal values for cardiac output and cardiac index
- Key differences that trip students up
- Why cardiac index is often preferred
- How both are measured in the cath lab
- Reading the two numbers together in practice
- Cardiac output vs cardiac index on the RCIS exam
- Key takeaways
Cardiac output vs cardiac index: the quick answer
Cardiac output (CO) is the total volume of blood the heart pumps per minute; cardiac index (CI) is that output divided by the patient's body surface area. In other words, cardiac index is cardiac output made comparable between people of different sizes. Same physiology, one extra step of arithmetic — but that step changes how you interpret the number.
Here is why the distinction matters. A cardiac output of 4.5 liters per minute could be perfectly healthy or quietly dangerous, and you cannot tell which until you know how big the patient is. A petite adult thrives on 4.5 L/min; a tall, muscular one may be sliding toward shock at the same value because their tissues demand far more flow. Cardiac index bakes body size into the number so the threshold means the same thing for everyone.
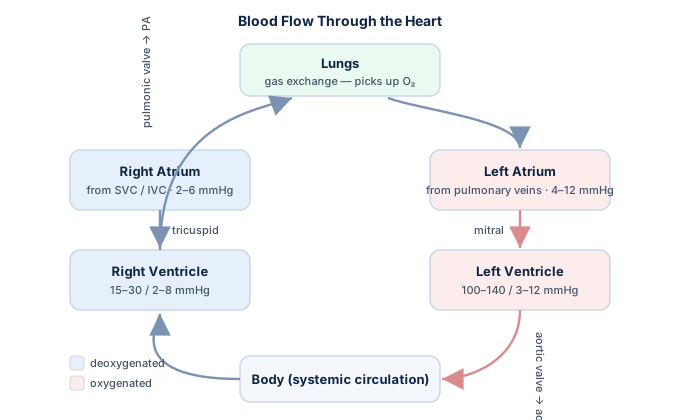
Both numbers are staples of the cath lab, the ICU, and the RCIS exam, and they anchor the wider web of hemodynamic values — from filling pressures to systemic vascular resistance. If you want the full landscape before drilling into this comparison, our hemodynamics study guide ties every measurement together.
This article is educational and not medical advice. Thresholds vary by patient, device, and institution; always follow current guidelines and local protocols.
What is cardiac output?
Cardiac output is the volume of blood the heart ejects into the circulation each minute, measured in liters per minute (L/min). It is the circulation's bottom line — the total flow that carries oxygen and nutrients to every tissue. If the heart is a pump, cardiac output is its throughput.
The defining relationship is worth committing to memory:
Cardiac output = stroke volume × heart rate
That is, cardiac output equals the amount of blood pushed out with each beat (the stroke volume) multiplied by how many times the heart beats per minute. A resting adult with a stroke volume near 70 mL and a heart rate of 70 beats per minute produces about 70 × 70 = 4,900 mL/min, or roughly 4.9 L/min. Change either factor and output moves with it — which is exactly how the body raises flow during exercise, either by beating faster or by ejecting more per beat.
Because output rides on both rate and stroke volume, it is remarkably adaptable. During hard exercise a trained heart can push cardiac output to 20 L/min or more; during severe bleeding or a failing pump it can fall by half. Our dedicated cardiac output guide walks through those swings and the measurement methods in more depth.
What is cardiac index?
Cardiac index is cardiac output normalized to body surface area, expressed in liters per minute per square meter (L/min/m²). It answers the question that raw output cannot: is this heart delivering enough flow for this particular body?
Two patients with identical outputs can have very different indices. Divide a 4.5 L/min output by a body surface area of 1.5 m² and you get 3.0 L/min/m² — solidly normal. Divide the same 4.5 L/min by a 2.4 m² frame and you get 1.9 L/min/m² — a value that would prompt concern. The output looked the same; the index told the truth. That is the entire reason the index exists, and it is why intensivists lean on it when they classify perfusion states.
Because body surface area is almost always larger than 1.0 m², cardiac index is always a smaller number than the cardiac output it came from. That makes for a quick sanity check: if someone quotes a "cardiac index" of 5 L/min/m², they have almost certainly reported cardiac output by mistake. Our full cardiac index explainer digs deeper into interpretation, and you can run the arithmetic instantly with the hemodynamic calculator.
The formulas side by side
Seeing the two equations together makes the relationship obvious — cardiac index is simply cardiac output with one more division.
| Measure | Formula | Units |
|---|---|---|
| Cardiac output (CO) | Stroke volume × heart rate | L/min |
| Cardiac index (CI) | Cardiac output ÷ body surface area | L/min/m² |
Written out, the two formulas are:
CO (L/min) = SV (mL) × HR (bpm)
CI (L/min/m²) = CO (L/min) ÷ BSA (m²)
Body surface area (BSA) is an estimate of total skin area computed from height and weight, usually with the Du Bois or Mosteller equation. A typical adult BSA is roughly 1.6 to 2.0 m². Let's carry one patient all the way through: a stroke volume of 75 mL at a heart rate of 72 bpm gives a cardiac output of 75 × 72 = 5,400 mL/min, or 5.4 L/min. If that patient's BSA is 2.0 m², the cardiac index is 5.4 ÷ 2.0 = 2.7 L/min/m² — comfortably normal on both counts.
Normal values for cardiac output and cardiac index
Here are the resting adult reference ranges you will be expected to know. As with all hemodynamic figures, textbooks and monitoring devices differ by a few tenths, so treat these as clinical guideposts rather than hard lines.
| Measure | Normal resting range | Adjusts for body size? |
|---|---|---|
| Cardiac output | ~4 – 8 L/min | No |
| Cardiac index | ~2.5 – 4.0 L/min/m² | Yes |
For cardiac index, two low thresholds are worth memorizing because they drive real decisions. A value below about 2.2 L/min/m² signals meaningful cardiac impairment, and an index under 1.8 L/min/m² in a patient with signs of poor perfusion sits squarely in cardiogenic-shock territory under the classic Forrester scheme. The table below maps the index onto clinical states.
| Cardiac index (L/min/m²) | Interpretation |
|---|---|
| > 4.0 | High output — sepsis, thyrotoxicosis, anemia, arteriovenous shunt, pregnancy |
| 2.5 – 4.0 | Normal resting range |
| 2.2 – 2.5 | Low-normal / early impairment; watch closely |
| 1.8 – 2.2 | Reduced output; frequently symptomatic heart failure |
| < 1.8 | Cardiogenic shock range with signs of hypoperfusion |
Both numbers drift with physiology: they fall gradually with age as resting metabolic demand declines, and they climb with exercise, fever, anemia, and pregnancy. A single reading is a snapshot — the trend over minutes to hours usually says more than any one value. For how the index feeds into shock classification, see our overview of shock hemodynamics.
Key differences that trip students up
Most confusion between these two comes down to four points. Get these straight and the topic stops being slippery.
| Cardiac output (CO) | Cardiac index (CI) | |
|---|---|---|
| What it measures | Total blood flow per minute | Flow per minute, per m² of body |
| Units | L/min | L/min/m² |
| Normal range | ~4 – 8 L/min | ~2.5 – 4.0 L/min/m² |
| Corrects for body size | No | Yes |
| Best used for | Trending one patient over time | Comparing patients; defining shock |
An analogy makes it stick. Cardiac output is like a car's total horsepower; cardiac index is horsepower-per-ton. A heavy truck and a light hatchback might share the same horsepower, but the number that predicts how briskly each actually accelerates is the power-to-weight ratio. Cardiac index is the cardiovascular power-to-weight ratio — and that is why it, not raw output, is the fairer basis for comparing two different patients or applying a universal shock cutoff.
- They are never independent. You cannot change the index without changing the output; the index is derived entirely from it plus BSA.
- The index is always the smaller number because BSA usually exceeds 1.0 m². A quoted "index" larger than the output is a red flag for a mislabeled value.
- Only the index has a size-independent threshold. "Below 2.2" means the same risk in a small and a large patient; "below 4 L/min" does not.
- Both depend on an accurate cardiac output. An error in the measured output propagates straight into the index.
Why cardiac index is often preferred
If cardiac output is the more intuitive number, why do critical-care teams so often reach for the index instead? Because clinical thresholds have to work across every body type, and only a size-adjusted number can do that. A universal rule like "treat cardiogenic shock below 1.8 L/min/m²" is meaningless in raw liters per minute, where the same absolute flow is generous for one patient and lethal for another.
Consider the scenario that exams love. Two patients each arrive with a cardiac output of exactly 4.0 L/min. Patient A has a BSA of 1.5 m² (index 2.7 — normal); patient B has a BSA of 2.3 m² (index 1.7 — shock). Judged by output alone, they look identical and equally reassuring. Judged by index, one goes home and the other gets inotropes and possibly mechanical support such as an intra-aortic balloon pump. The index caught a difference the output completely hid.
That said, cardiac output has its own place. For following a single patient over time — say, watching output climb as you titrate an inotrope — the raw number is perfectly adequate and avoids the extra assumption baked into BSA. The two are complementary: output for trending one person, index for comparing across people and for applying fixed decision thresholds. Both feed into calculations like systemic vascular resistance, which the physician reads alongside the index to separate a pump problem from a vascular one.
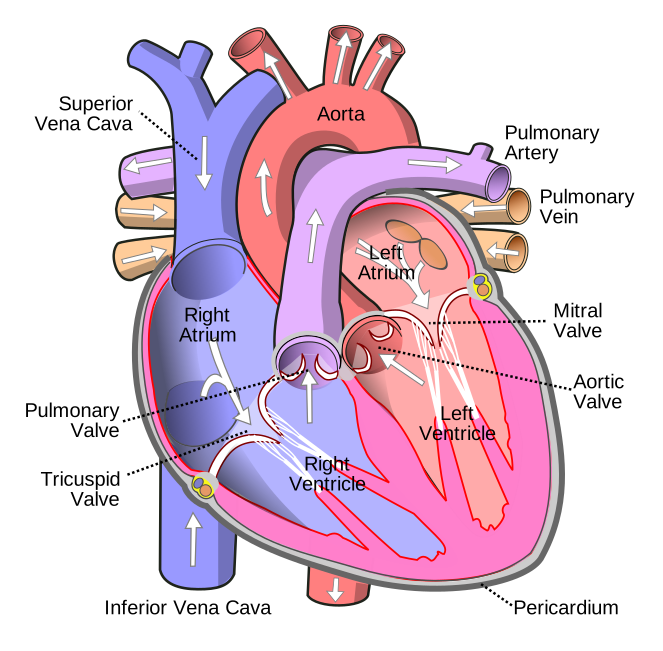
How both are measured in the cath lab
Neither number is read off a dial directly. You measure cardiac output, then divide by a computed BSA to get the index — so getting the output right is the whole game. Several established methods supply that output.
- Thermodilution is the cath-lab and ICU workhorse. A bolus of cold saline is injected through a Swan-Ganz (pulmonary artery) catheter, and a downstream thermistor tracks how fast the blood rewarms. The area under that temperature curve is inversely proportional to flow. Modern PA catheters can also report continuous output.
- The Fick principle derives output from oxygen consumption divided by the arteriovenous oxygen difference. It is the reference standard in low-output states, where thermodilution grows unreliable; our Fick calculator walks through the arithmetic.
- Echocardiography estimates stroke volume from the left ventricular outflow tract and multiplies by heart rate — a noninvasive route covered in our echocardiogram guide, where the ejection fraction is often reported in the same study.
- Pulse-contour and bioreactance devices analyze the arterial waveform or thoracic electrical signals to trend output continuously and less invasively.
Whatever produces the output, the monitor then divides by the patient's BSA to display the index. Because BSA errors propagate directly, a wrong height or weight quietly skews every derived value — and the same output-measurement pitfalls apply to both numbers: shivering or arrhythmia during thermodilution, wrong injectate temperature, or a malpositioned catheter can throw the reading off. Recognizing an implausible result and repeating the measurement is a mark of a skilled tech. For the broader environment where this happens, see what a cardiac cath lab actually involves.
Reading the two numbers together in practice
At the bedside you rarely look at output or index in isolation — you read them against each other and against the rest of the hemodynamic panel. A few patterns recur often enough to be worth rehearsing.
| Pattern | What it suggests |
|---|---|
| Normal output, low index (large patient) | Flow that looks adequate is actually insufficient for body size — do not be reassured by the output alone |
| Low output and low index | Genuine pump failure — heart failure, large infarct, tamponade — escalate support |
| High output and high index, low resistance | Distributive picture such as sepsis ("warm shock") — flow is high but poorly distributed |
| Normal index, rising heart rate, falling stroke volume | Compensated state — tachycardia is defending output as each beat weakens |
That last row is the subtle one. Because output is stroke volume times heart rate, a patient whose stroke volume is quietly collapsing can hold output — and therefore index — near normal simply by speeding up. A racing pulse may be defending a failing beat, and reading the numbers together is what reveals it. Restrictive and obstructive processes cut flow from different directions: cardiac tamponade limits filling, while critical aortic stenosis obstructs ejection, and both can drop output and index while heart rate climbs to compensate.
None of these patterns is diagnostic on its own. The clinical team reads output and index alongside filling pressures, resistance, lactate, urine output, and imaging before acting — which is exactly the integrated thinking the RCIS exam is testing. This is general physiology education, not medical advice for any specific patient.
Cardiac output vs cardiac index on the RCIS exam
For cardiovascular technologists and RCIS candidates, this comparison is not academic — you help generate both numbers during nearly every right-heart catheterization. When you run a thermodilution set or perform an oximetry run for a Fick calculation, the output and the index that fall out feed the physician's read on pump function, shunt severity, and readiness for intervention.
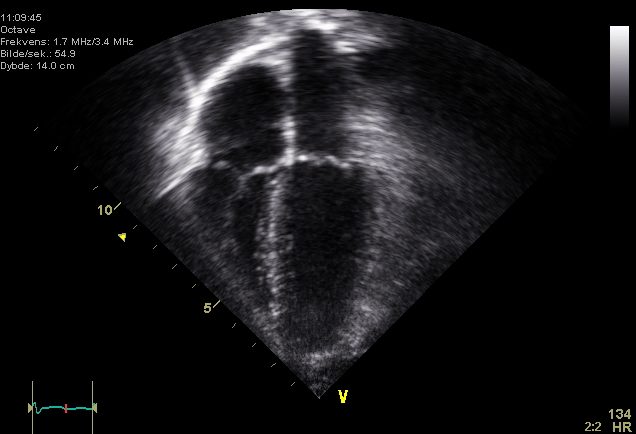
Expect the exam to test whether you can move fluently between the two. A question may give you stroke volume and heart rate and ask for output, then hand you a BSA and ask for the index; another may give you an index and ask you to classify the patient as normal, impaired, or in shock. You should also be ready to tell output and index apart from stroke volume, ejection fraction, and resistance inside a single scenario. Shore up the underlying structure with our cardiac anatomy guide, then drill the math with our hemodynamics practice questions.
Understanding the electrical side helps too, since rate is half of the output equation — a review of the ECG fundamentals keeps the heart-rate variable grounded in real rhythms rather than a number on a screen.
Key takeaways
- Cardiac output = stroke volume × heart rate, measured in L/min; cardiac index = cardiac output ÷ body surface area, in L/min/m². The index is output scaled to body size.
- Normal cardiac output is about 4–8 L/min; normal cardiac index is about 2.5–4.0 L/min/m². The index is always the smaller number.
- Cardiac index is preferred for comparing patients and applying fixed thresholds because it corrects for body size; cardiac output is fine for trending a single patient over time.
- Two low index thresholds matter: below 2.2 L/min/m² signals real impairment, and below 1.8 L/min/m² with hypoperfusion defines cardiogenic shock.
- Both are calculated from a measured cardiac output (thermodilution, Fick, or echo) — so accuracy depends on a reliable output and a correct BSA.
- Read the two together, not in isolation: a normal output can hide a low index in a large patient, and a stable index can mask a failing stroke volume defended by tachycardia.
- This content is educational, not medical advice; thresholds are evolving, so defer to current guidelines and local protocols.
Frequently asked questions
What is the difference between cardiac output and cardiac index?
Cardiac output is the total volume of blood the heart pumps per minute, measured in liters per minute (L/min). Cardiac index is that same output divided by the patient's body surface area, measured in L/min/m². The index adjusts for body size, so it lets you compare patients fairly and apply universal thresholds; the output does not.
What are the formulas for cardiac output and cardiac index?
Cardiac output = stroke volume × heart rate (CO in L/min). Cardiac index = cardiac output ÷ body surface area (CI in L/min/m²). For example, a stroke volume of 75 mL at 72 bpm gives an output of 5.4 L/min; divided by a BSA of 2.0 m², the index is 2.7 L/min/m².
What are the normal values for cardiac output and cardiac index?
A resting adult cardiac output is roughly 4 to 8 L/min, and a normal cardiac index is about 2.5 to 4.0 L/min/m². Exact cutoffs vary between textbooks and monitoring devices, and both values fall with age and rise with exercise, fever, and pregnancy.
Why is cardiac index used instead of cardiac output?
Because raw output ignores body size. A 4.5 L/min output is healthy for a small adult but inadequate for a large one. Indexing to body surface area makes the number comparable across patients and lets clinicians apply a single threshold — such as below 1.8 L/min/m² for cardiogenic shock — to everyone.
Is cardiac index always lower than cardiac output?
Yes, in essentially all adults, because body surface area is almost always greater than 1.0 m². Dividing output by a number larger than one produces a smaller result. If a reported cardiac index is larger than the cardiac output, the values have very likely been mislabeled.
Which is more important, cardiac output or cardiac index?
Neither is universally better — they serve different jobs. Cardiac index is preferred for comparing different patients and for applying fixed clinical thresholds like shock cutoffs, while cardiac output is well suited to trending a single patient over time, such as watching flow improve as an inotrope is titrated.
Can cardiac output be normal while cardiac index is low?
Yes. In a large patient, an output that looks adequate in liters per minute can translate into a low index once it is divided by a big body surface area. That is precisely why the index is valuable — it can reveal insufficient perfusion that the raw output number hides.
How are cardiac output and cardiac index measured?
Cardiac output is measured by thermodilution through a Swan-Ganz catheter, by the Fick oxygen method, or by echocardiography; pulse-contour devices can trend it continuously. Cardiac index is then calculated by dividing that measured output by the patient's body surface area — it is never measured directly.
What cardiac index indicates cardiogenic shock?
A cardiac index below about 1.8 L/min/m² accompanied by signs of poor perfusion — cool skin, low urine output, rising lactate, altered mental status — is in the cardiogenic-shock range under the classic Forrester classification. An index under 2.2 L/min/m² already signals significant cardiac impairment and warrants close attention.
Sources & further reading
- Cardiovascular Credentialing International (CCI)
- American College of Cardiology
- American Heart Association
- MedlinePlus (U.S. National Library of Medicine)
External links are provided for reference; always confirm current details with the official source.