Aortic Valve Area & Aortic Stenosis Severity
Aortic valve area is the number that turns a heart murmur into a decision. It tells clinicians how tightly the aortic valve has narrowed — and whether a patient with aortic stenosis needs watchful waiting, a surgical valve, or a catheter-based replacement.
What is aortic valve area?
Aortic valve area (AVA) is the size of the opening the left ventricle must push blood through during systole, measured in square centimeters. A normal adult aortic valve opens to roughly 3.0 to 4.0 cm². When disease stiffens and calcifies the leaflets, that opening shrinks. The heart has to generate more pressure to force the same volume of blood through a smaller hole, and that pressure difference — the gradient — becomes the fingerprint of aortic stenosis.
Think of it like a garden hose. Pinch the nozzle and the water speeds up while the pressure behind your thumb climbs. The aortic valve behaves the same way. As the valve area falls, blood velocity across it rises and the pressure gradient between the left ventricle and the aorta widens. Measuring that relationship — flow, velocity, and gradient — is how we back-calculate the valve area itself.
Why does the exact number matter so much? Because AVA is threshold-driven. A valve area of 1.2 cm² and one of 0.8 cm² can produce similar-sounding murmurs at the bedside, yet they sit on opposite sides of the line that separates moderate from severe disease. That single measurement, taken together with symptoms, often decides whether a patient is referred for valve replacement.
This article is written for students and clinicians preparing for exams such as the RCIS, and for anyone who wants to understand the numbers behind an aortic stenosis workup. It is educational and not a substitute for medical advice.
Grading aortic stenosis severity
Guidelines from the American College of Cardiology and American Heart Association, echoed by the European Society of Cardiology, grade aortic stenosis severity using three linked measurements: the peak aortic jet velocity, the mean transaortic pressure gradient, and the aortic valve area. In an ideal patient all three agree. When they do not, the discrepancy itself becomes a clue — more on that later.
| Severity | Peak jet velocity | Mean gradient | Aortic valve area |
|---|---|---|---|
| Aortic sclerosis | ≤ 2.5 m/s | — | Normal |
| Mild | 2.6–2.9 m/s | < 20 mmHg | > 1.5 cm² |
| Moderate | 3.0–3.9 m/s | 20–39 mmHg | 1.0–1.5 cm² |
| Severe | ≥ 4.0 m/s | ≥ 40 mmHg | < 1.0 cm² |
| Very severe | ≥ 5.0 m/s | ≥ 60 mmHg | < 1.0 cm² |
A few anchors are worth memorizing cold. Severe aortic stenosis begins at a jet velocity of 4 m/s, a mean gradient of 40 mmHg, and a valve area under 1.0 cm². Because valve area depends on body size, guidelines also cite an indexed threshold of 0.6 cm²/m², which matters most in very small or very large patients.
Notice that gradient is flow-dependent while valve area is meant to be flow-independent. A vigorous, high-output heart can drive a big gradient across a only-moderately narrowed valve, and a weak, low-output heart can produce a deceptively small gradient across a critically tight one. That tension is why we never grade aortic stenosis on gradient alone.
Calculating AVA: Gorlin, Hakki, and continuity
There are two worlds in which aortic valve area gets measured: the cath lab, using invasive pressures and cardiac output, and the echo lab, using Doppler velocities. Each has its own equation, and knowing all three is a favorite exam target.
The Gorlin equation
The Gorlin formula is the invasive gold-standard reference. It derives valve area from cardiac output and the pressure gradient measured directly across the valve:
AVA = Cardiac Output ÷ (44.3 × SEP × HR × √mean gradient)
Here SEP is the systolic ejection period, HR is heart rate, and 44.3 is an empiric constant. The equation captures a crucial truth: valve area is proportional to flow divided by the square root of the gradient. Halve the flow and the calculated gradient falls to a quarter, not a half — which is exactly why low flow makes severe stenosis look mild. Accurate Gorlin numbers depend on a clean cardiac output measurement, usually by the Fick method or thermodilution.
The Hakki simplification
The Hakki equation is a bedside shortcut that strips Gorlin down to something you can do in your head:
AVA ≈ Cardiac Output ÷ √peak-to-peak gradient
It works because the constants and rate terms in Gorlin roughly cancel at normal heart rates. Hakki is remarkably close to Gorlin for most patients, drifting off only at very high or very low heart rates. It is the number to reach for when you want a fast sanity check on a cath report.
The continuity equation
On echo, valve area comes from the continuity equation, which rests on a simple conservation principle: the stroke volume that passes through the left ventricular outflow tract (LVOT) must also pass through the valve. What speeds up must have narrowed.
AVA = (LVOT area × LVOT VTI) ÷ Aortic VTI
The sonographer measures the LVOT diameter to get its cross-sectional area, then records the velocity-time integral (VTI) below the valve and across it. The valve area falls out of the ratio. The classic pitfall is the LVOT diameter: because it is squared, a small measurement error is magnified into a large area error. Anyone training as a cardiovascular ultrasound technologist spends real time getting that single measurement right.
The hemodynamics behind the gradient
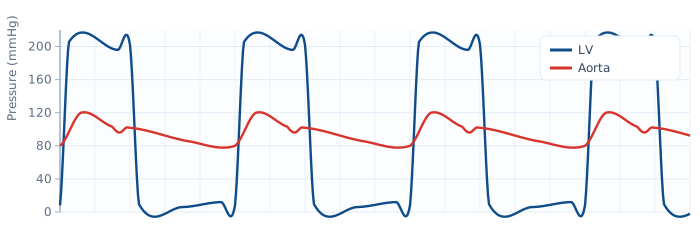
To measure aortic stenosis in the cath lab you record left ventricular and aortic pressure simultaneously, ideally with a dual-lumen or pigtail catheter pulled back across the valve. In a normal heart the two systolic pressures nearly overlap. In aortic stenosis, LV pressure climbs steeply while aortic pressure lags behind, and the space between the two curves is the gradient you are hunting for.
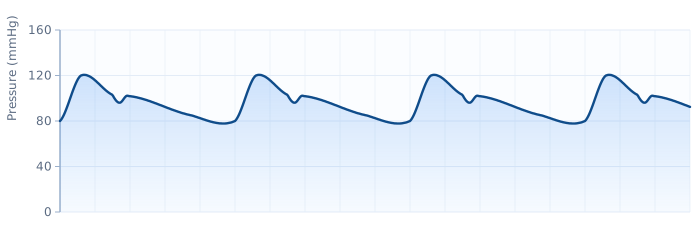
The aortic tracing itself changes character. The normal brisk upstroke flattens into the classic pulsus parvus et tardus — a pulse that is both weak (parvus) and late (tardus). You can sometimes see an anacrotic notch on the slow upstroke. These waveform signatures are exactly the kind of pattern-recognition the exam loves, and they reinforce the broader principles covered in our hemodynamics study guide.
One measurement trap deserves special mention. The peak-to-peak gradient (the difference between peak LV and peak aortic pressure, used in Hakki) is not the same as the peak instantaneous gradient that Doppler reports. Because the LV and aortic pressures peak at slightly different moments, the Doppler peak instantaneous gradient is always larger than the catheter peak-to-peak gradient. The echo mean gradient, by contrast, tracks the catheter mean gradient closely — which is why guidelines lean on the mean. Practicing these tracings alongside our hemodynamics question bank is the fastest way to make the distinction stick. To rehearse the underlying pressure-flow relationships, the hemodynamic calculator lets you vary output and gradient and watch the valve area respond.
The low-flow, low-gradient puzzle
Here is where aortic stenosis gets genuinely hard. The three grading numbers — velocity, gradient, and area — are supposed to agree. In perhaps a third of severe cases they do not, and the most treacherous mismatch is low-flow, low-gradient (LFLG) aortic stenosis: a valve area under 1.0 cm² that would call it severe, paired with a mean gradient under 40 mmHg that would call it only moderate.
The reason is flow. Remember that gradient scales with the square of flow. If the ventricle is not moving enough blood, it cannot generate a big gradient even across a pinhole valve. Two distinct patients fall into this trap:
- Classical LFLG — a weak ventricle with reduced ejection fraction (below 50%). The heart is too impaired to build a high gradient.
- Paradoxical LFLG — a preserved ejection fraction but a small, stiff, hypertrophied ventricle with a low stroke volume index. The percentage looks fine, but the absolute volume ejected is small.
The stakes are high because these patients are often the sickest, yet their gradient falsely reassures. Sorting real severe stenosis from a valve that merely looks tight because of low flow changes the entire management plan.
When dobutamine echo is inconclusive, aortic valve calcium scoring by CT has become the modern arbiter. Heavy calcification supports true severe stenosis independent of flow. This is an area of active refinement in the guidelines, so the specifics continue to evolve — treat published cutoffs as strong guidance rather than absolute law.
Symptoms and why timing matters
Aortic stenosis is patient in the worst way. It can smolder silently for decades, then turn dangerous fast once symptoms appear. The classic triad is captured by the mnemonic SAD: Syncope, Angina, Dyspnea. Each marks a grim shift in prognosis.
| Symptom | Mechanism | Untreated survival (historical) |
|---|---|---|
| Angina | Thickened muscle outstrips its blood supply | ~5 years |
| Syncope | Fixed output cannot meet exertional demand | ~3 years |
| Dyspnea / heart failure | Rising filling pressures back up into the lungs | ~2 years |
Those survival figures come from the pre-replacement era, but they still make the point: once a severely stenotic valve becomes symptomatic, the clock is running. The chest pain can occur with completely normal coronary arteries, purely from supply-demand mismatch in the hypertrophied muscle — a detail that trips up many test-takers who assume angina always means blocked arteries or a looming myocardial infarction.
Because symptoms are the trigger for intervention, clinicians probe for them carefully, sometimes with exercise testing in patients who claim to be asymptomatic. A patient who says they feel fine but stops at one flight of stairs may not be asymptomatic at all — they have simply slowed down to stay under the threshold.
Treatment: TAVR vs SAVR
There is no pill that reopens a calcified aortic valve. Definitive treatment means replacing it, and the modern debate is TAVR versus SAVR.
- SAVR (Surgical Aortic Valve Replacement) — open-heart surgery on cardiopulmonary bypass, exchanging the diseased valve for a mechanical or bioprosthetic one. The long-established standard.
- TAVR (Transcatheter Aortic Valve Replacement) — a bioprosthetic valve crimped onto a catheter, threaded usually through the femoral artery, and deployed inside the native valve. No sternotomy, no bypass, far shorter recovery.
TAVR began as a rescue for patients too frail for surgery, then climbed the risk ladder. Landmark trials have now shown it non-inferior or superior to surgery across high, intermediate, and low surgical-risk groups, and it has overtaken SAVR in overall volume in many countries. Current ACC/AHA guidance frames the choice around age, surgical risk, valve anatomy, and — importantly — patient preference, decided by a multidisciplinary heart team.
Age is often the swing factor. Younger patients may still be steered toward surgery, partly because long-term durability data for transcatheter valves are still maturing and partly because a mechanical valve can outlast them. Older patients, or those with hostile chest anatomy, lean strongly toward TAVR. This remains an evolving field, and thresholds shift as durability data accumulate. The procedures themselves live in the interventional world explained in our overview of what happens in a cardiac cath lab, and they sit alongside coronary work such as PCI versus diagnostic catheterization.
None of this is medical advice. Valve-replacement decisions are individualized and belong to a patient and their heart team, not a study guide.
How to lock this in for the exam
Aortic valve area sits at the crossroads of anatomy, hemodynamics, and echo — which is precisely why it shows up so often on the RCIS and related exams. A few strategies pay off.
- Anchor the severe thresholds first. "4, 40, 1" (velocity, gradient, area) is the backbone. Everything else hangs off it.
- Understand the flow-gradient link, don't just memorize it. If you truly grasp that gradient scales with the square of flow, low-flow low-gradient AS stops being a trick question.
- Draw the pressure overlay. Sketch LV and aortic tracings and shade the gradient. The picture cements the concept far better than the words.
- Keep the three equations straight by their inputs. Gorlin and Hakki use output and gradient (cath); continuity uses areas and velocities (echo).
Round out your preparation by reviewing the linked pillars: the broader hemodynamics guide for pressures and gradients, the echocardiogram basics for how the continuity equation is actually acquired, and the fundamentals of cardiac anatomy so the LVOT and valve geometry make intuitive sense.
Key takeaways
- Aortic valve area is normally 3–4 cm²; severe aortic stenosis is defined by an area under 1.0 cm² (or 0.6 cm²/m² indexed).
- Remember "4, 40, 1": severe AS = jet velocity ≥ 4 m/s, mean gradient ≥ 40 mmHg, valve area < 1 cm².
- The Gorlin equation is the invasive reference; Hakki is its bedside shortcut (CO ÷ √gradient); the continuity equation is the echo method.
- Gradient depends on flow, so low-flow, low-gradient AS can hide severe disease — use dobutamine stress echo or calcium scoring to unmask it.
- Symptoms (syncope, angina, dyspnea) mark a sharp drop in survival and are the usual trigger for valve replacement.
- TAVR now rivals or beats SAVR across the surgical-risk spectrum, with the choice individualized by a heart team.
- This is educational material for exam preparation, not medical advice.
Calculate aortic valve area
Use the continuity, Gorlin, or Hakki equation to estimate AVA and grade stenosis.
Open the AVA Calculator →Frequently asked questions
What is a normal aortic valve area?
A normal adult aortic valve opens to about 3.0 to 4.0 cm². Symptoms of aortic stenosis rarely appear until the area falls below roughly 1.0 cm², which is the threshold for severe disease. Mild stenosis is greater than 1.5 cm² and moderate is 1.0 to 1.5 cm².
What aortic valve area is considered severe aortic stenosis?
Severe aortic stenosis is defined by a valve area of less than 1.0 cm², typically alongside a peak jet velocity of at least 4 m/s and a mean gradient of at least 40 mmHg. An indexed area below 0.6 cm²/m² is also used, especially in patients with unusual body size.
What is the difference between the Gorlin and Hakki equations?
Both calculate aortic valve area from invasive data. The Gorlin equation is the full reference formula and factors in the systolic ejection period, heart rate, and an empiric constant. The Hakki equation is a simplified bedside version, valve area equals cardiac output divided by the square root of the gradient, and it closely approximates Gorlin at normal heart rates.
What is the continuity equation for aortic valve area?
The continuity equation is the echocardiographic method. It states that the stroke volume through the LV outflow tract equals the stroke volume through the valve, so AVA equals (LVOT area multiplied by LVOT velocity-time integral) divided by the aortic velocity-time integral. The main source of error is the LVOT diameter, which is squared.
What is low-flow, low-gradient aortic stenosis?
It is a mismatch where the calculated valve area indicates severe stenosis (under 1.0 cm²) but the mean gradient is under 40 mmHg, suggesting only moderate disease. It happens because a low-output heart cannot generate a high gradient. It comes in two forms: classical (reduced ejection fraction) and paradoxical (preserved ejection fraction with a small, stiff ventricle).
How do you tell true severe from pseudo-severe aortic stenosis?
A low-dose dobutamine stress echo raises cardiac output. If the gradient climbs while the valve area stays small and fixed, the stenosis is truly severe. If the area opens up as flow increases, it was pseudo-severe. Aortic valve calcium scoring by CT is a flow-independent alternative when the stress echo is inconclusive.
What are the symptoms of severe aortic stenosis?
The classic triad is syncope, angina, and dyspnea, remembered by the mnemonic SAD. Their appearance marks a sharp drop in untreated survival, historically about 3 years after syncope, 5 after angina, and 2 after heart failure, which is why symptoms usually trigger referral for valve replacement.
What is the difference between TAVR and SAVR?
SAVR is surgical aortic valve replacement, an open operation on cardiopulmonary bypass. TAVR is transcatheter aortic valve replacement, in which a valve is delivered by catheter, usually through the femoral artery, without opening the chest. TAVR has proven non-inferior or superior to surgery across high, intermediate, and low surgical-risk patients, though the choice is individualized by a heart team.
Why does aortic stenosis cause angina with normal coronary arteries?
The thickened, hypertrophied left ventricle needs more oxygen while the fixed valve limits how much blood can be pumped to feed it. This supply-demand mismatch produces chest pain even when the coronary arteries are completely open, which is why angina in aortic stenosis does not always mean coronary artery disease.
Sources & further reading
- Cardiovascular Credentialing International (CCI)
- American College of Cardiology
- American Heart Association
- MedlinePlus (U.S. National Library of Medicine)
External links are provided for reference; always confirm current details with the official source.